Owning a Franchise: What the FDD Actually Reveals
About 851,000 franchised establishments and more than $936.4 billion in projected 2025 U.S. franchise output establish the scale of owning a franchise, but national growth describes the system, not any single unit. For franchise development leaders, ownership should be underwritten as a capital-duration and labor-resilience problem, not an entry-fee transaction.
For established brands, the operating question is whether a proposed franchisee can finance the interval between opening and sustainable cash generation. FDD Items 7, 19, and 20 provide the analytical spine: investment requirements, disclosed financial performance, and evidence of outlet growth and ownership turnover.
Table of Contents
- What Owning a Franchise Means Inside an $800 Billion System
- Reading FDD Items 5 Through 7 as a Capital Stack
- Using Item 19 to Build a Location-Level Pro Forma
- Single-Unit, Multi-Unit, and Area Development Compared
- Why Labor Scarcity Changes the Capital You Should Reserve
- What Item 20 Churn and Default Rates Reveal About a Brand
- Building Your Franchise Diligence Sequence
What Owning a Franchise Means Inside an $800 Billion System
The International Franchise Association's outlook projected more than 20,000 additional establishments, approximately 2.5% growth, alongside roughly 210,000 additional jobs, a 2.4% gain that would bring franchise employment above 9 million workers in 2025. It also projected output growth of approximately 4.4%, from $896.9 billion in 2024, and franchise-generated GDP of approximately $578 billion, up about 5% (IFA 2025 Economic Outlook).
Those are projections of aggregate activity, not realized results or unit-level underwriting assumptions. A brand president cannot infer a location's rent coverage, staffing capacity, or distributable cash from national output.
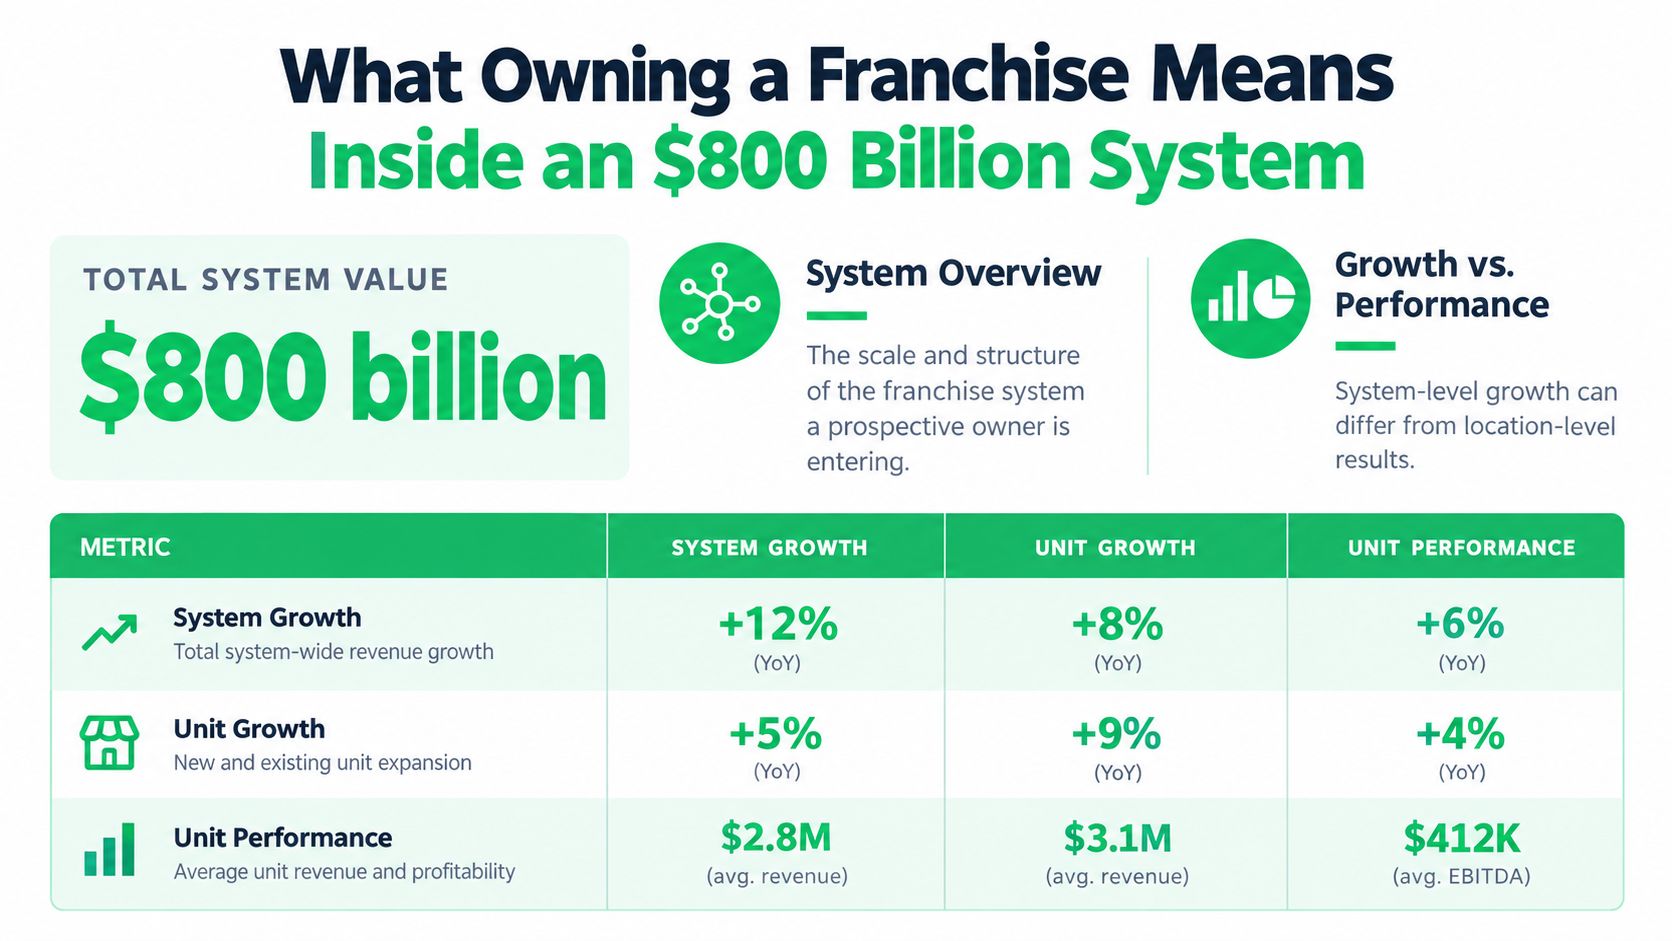
System Expansion and Unit Economics Answer Different Questions
| Analytical level | What the evidence establishes | What remains unproven |
|---|---|---|
| National economic outlook | Projected system expansion and employment | Performance of a particular territory |
| Brand outlet growth | Changes in operating footprint | Durability of franchisee ownership |
| Location financial model | Economics under stated assumptions | Performance outside those assumptions |
The relevant comparison set should identify the operating category: quick-service restaurants (QSR), home services, real estate brokerages, fitness and wellness, automotive services, health and beauty, retail, education, or senior care. Analysts should then compare the actual Item 7 cost schedules and Item 19 disclosures, rather than treating those categories as interchangeable ownership models.
A QSR development team should examine the disclosed restaurant investment and staffing assumptions. A home services team should examine the disclosed equipment, vehicle, and operating requirements. Neither analysis becomes more reliable merely because the national franchise economy is expanding.
Underwriting premise: System growth establishes context. Location quality, capital structure, operating execution, market demand, and franchisor support determine whether the proposed unit model is credible.
For development executives, that distinction changes candidate qualification. Available investment capital matters, but the relevant test is whether that capital supports the disclosed operating model through an adverse ramp period. Owning a franchise is a duration commitment, and Item 7 is the starting estimate rather than a substitute for a downside forecast.
Reading FDD Items 5 Through 7 as a Capital Stack
Items 5, 6, and 7 define different points in the franchisee's capital timeline: fees due before opening, charges during operations, and the estimated investment to launch and fund initial operations. An analyst should read the three schedules together, then test how long available capital can support the unit if revenue ramps slowly. The disclosed investment range is an opening estimate, not a full downside cash forecast.
FDD Cost Items and What Each One Commits
| FDD Item | What It Discloses | Cost Type |
|---|---|---|
| Item 5 | Initial franchise fees and other initial fees | Upfront commitment |
| Item 6 | Other fees, including applicable royalties, advertising contributions, and technology charges | Continuing or event-triggered obligation |
| Item 7 | Estimated initial investment, including startup expenditures and additional funds | Opening capital and initial operating provision |
Classify every obligation by recipient, due date, recurrence, and sales sensitivity. The initial franchise fee reduces cash before operations begin. Royalties and other recurring charges affect liquidity after opening, while event-triggered fees create obligations under specific conditions. A payment calendar exposes the sequence more clearly than a single total.
Item 7 is not a recurring-cost model. Reconcile its estimates with Item 6, and identify which charges remain due during a slower-than-expected ramp. Keep percentage-based royalties separate from fixed fees, and distinguish required advertising contributions from local marketing spending the franchisee controls.
Normalize Costs Within Each Operating Category
Compare line items within the same operating category, rather than assuming all franchise formats have equivalent cost structures. In quick-service restaurants (QSR), isolate build-out and equipment. For home services, examine any disclosed vehicle and equipment package. For health and beauty, review studio fit-out and operating requirements. These are items to verify in the relevant FDD, not presumed rankings of total cost.
Required vendor purchases and technology fees should have separate lines whenever the FDD discloses them. Keeping them visible lets analysts test changes in purchasing requirements and payment timing without burying those costs in a general overhead allowance.
The capital requirements for qualified franchisees should be assessed against both opening commitments and the liquidity left afterward. Capital allocated to construction, equipment, fees, or required purchases may not remain available to cover operating shortfalls. Total funds on hand therefore do not equal unrestricted cash throughout the project.
A downside review should model the cash buffer after disclosed opening costs, then estimate how long that reserve can cover ongoing obligations during a weak ramp. The approval test is specific: after opening commitments are funded, how much unrestricted liquidity remains to support the operating downside? That measure connects qualification to capital duration and the unit's ability to withstand labor or revenue pressure.
Using Item 19 to Build a Location-Level Pro Forma
Item 19 is the FDD's designated place for a franchisor's financial performance representation. The FTC does not require franchisors to disclose sales or earnings. If a franchisor makes a financial performance representation, it must appear in Item 19 with a reasonable factual basis and supporting information, limitations, and assumptions. The franchisor, broker, or seller cannot make such claims outside that framework.
For a brand president, the control test is whether development communications match the disclosure. An analyst's scenario model can inform investment decisions, but it does not authorize sales staff to make unsupported earnings claims.
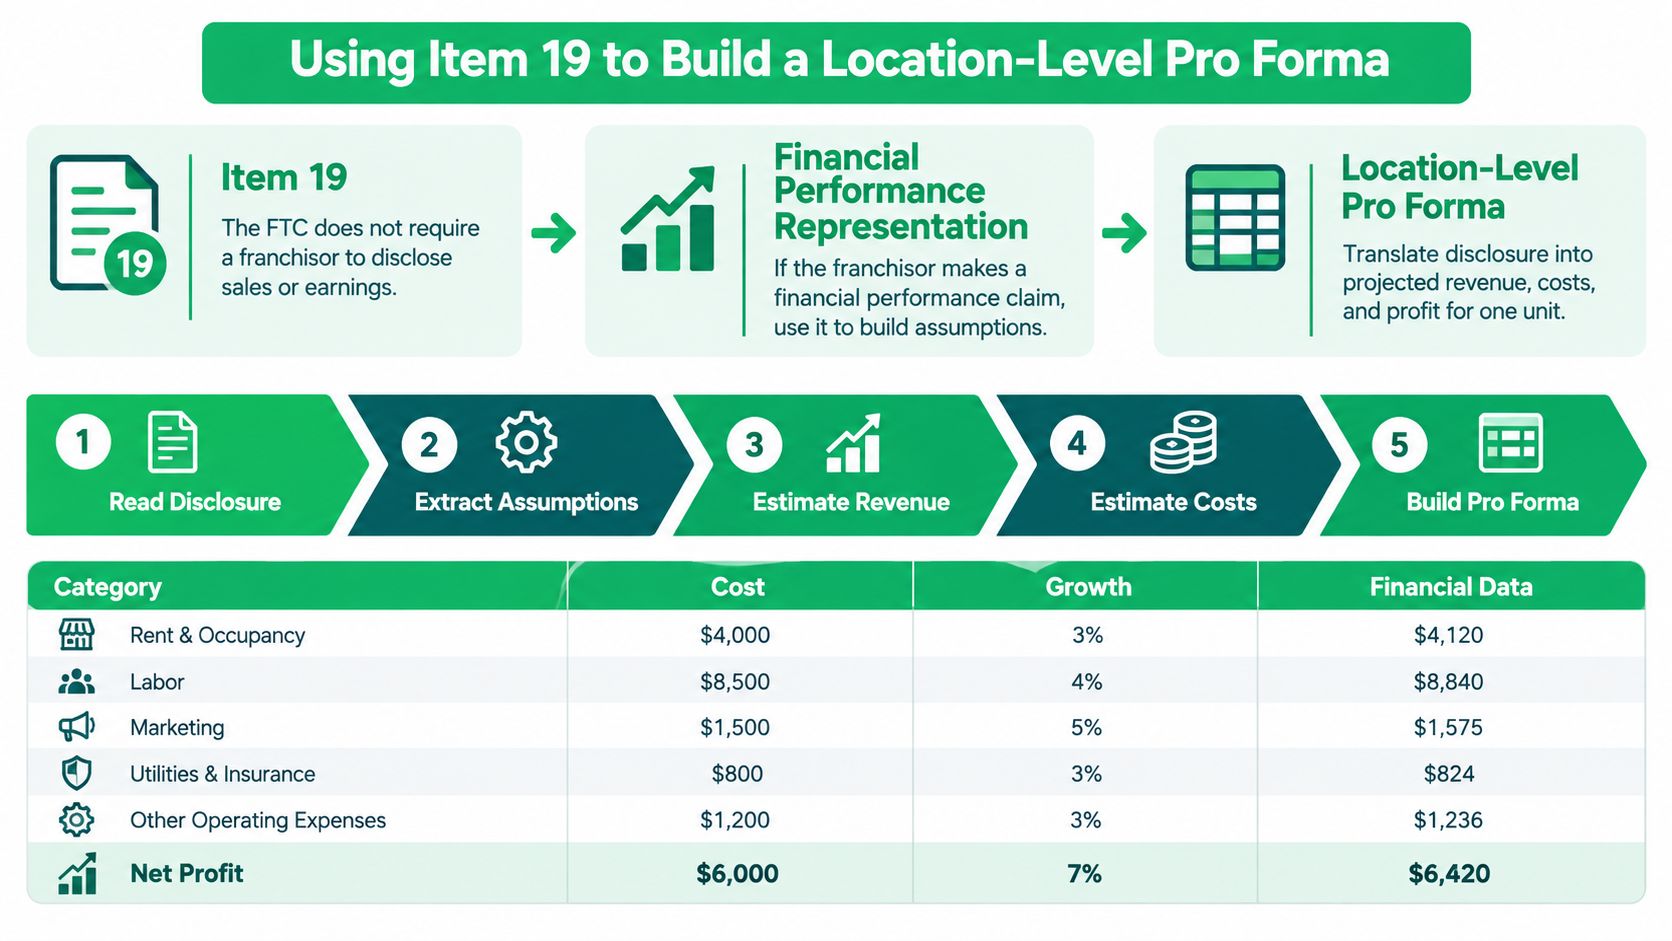
Separate Disclosure Evidence From Model Assumptions
Before using an Item 19 revenue figure, record its population, measurement period, exclusions, and cost coverage. If Item 19 omits an expense, identify the amount in the model as an analyst-developed assumption, not a franchisor-reported result.
| Model layer | Analytical treatment |
|---|---|
| Revenue | Retain the Item 19 definition and disclosed limitations |
| Variable operating costs | Deduct applicable sales-sensitive labor, goods, and fees |
| Fixed operating costs | Deduct rent, insurance, fixed technology charges, and management costs |
| Financing and owner cash flow | Account for debt service and cash available for distribution |
| Invested equity | Use a consistent denominator for cash-on-cash analysis |
Contribution margin, operating profit, and owner cash flow measure different things. Contribution margin deducts variable costs; break-even analysis also accounts for fixed costs. Cash-on-cash analysis requires a defined cash-flow measure and invested-equity base. This separation helps explain why higher franchise sales don't guarantee profits.
Test Liquidity Against Cumulative Cash Burn
Model lower sales, higher labor costs, a slower ramp-up, and delayed break-even together. Testing each condition in isolation can understate the cash exposure when staffing pressure and revenue delays coincide.
Gross sales aren't personal income. The underwriting decision depends on costs outside the disclosure and the cash required before the unit becomes self-funding.
Development leaders should reconcile disclosed evidence and model assumptions with the proposed franchisee's available liquidity. A favorable annual result does not cover an interim funding gap if payroll, rent, and debt payments fall due before cash generation improves. The pro forma should therefore show cumulative cash burn and the reserve needed to fund that gap, not just an annual operating result.
Single-Unit, Multi-Unit, and Area Development Compared
FRANdata's ownership figures show expansion across multi-unit cohorts, but the figures don't establish that a larger development commitment is suitable for every operator. Operators with 2 to 5 units increased from 28,862 in 2010 to 34,218 in 2025; those with 26 to 50 units increased from 397 to 615; and operators with more than 50 units increased from 162 to 504 (FRANdata multi-unit ownership trends).
Multi-Unit Ownership Cohort Growth, 2010 to 2025
| Unit Count | 2010 Operators | 2025 Operators |
|---|---|---|
| 2 to 5 | 28,862 | 34,218 |
| 26 to 50 | 397 | 615 |
| More than 50 | 162 | 504 |
The development implication is narrower than a general endorsement of scale. Operator count measures ownership prevalence, not management readiness, reserve adequacy, or incremental returns. A franchise sales director should therefore evaluate the next commitment against operating evidence rather than use existing unit count as a qualification shortcut.
| Ownership structure | Recommended underwriting emphasis | Expansion question |
|---|---|---|
| Single-unit | Location economics and owner dependence | Would reinvestment improve the existing operation? |
| Multi-unit | Manager readiness and shared infrastructure | Can the operator expand without weakening existing units? |
| Area development | Capital sequencing and contractual schedule | Can the operator fund commitments under delayed openings? |
Expansion Approval Should Follow Operating Maturity
A staged approval scorecard should assess unit-level profitability, manager readiness, cash reserves, debt-service coverage, and franchisor support. The thresholds should come from the brand's documented operating evidence and financing requirements, not an invented industry-wide benchmark.
Geographic concentration also belongs in the decision. An analyst should test exposure to the same labor market, landlord relationships, and local economy before interpreting nearby units as operational efficiency. Territory restrictions and potential cannibalization should be evaluated against the applicable FDD disclosures and agreements.
For development teams that explore different franchise ownership options, the decisive comparison is incremental capital allocation. Opening another location should be evaluated against reinvesting in the current location, retaining liquidity, or strengthening management coverage.
Additional units should follow demonstrated operating capacity. Otherwise, the development team may convert a franchisee's unresolved staffing or cash-flow problem into a broader portfolio exposure.
Why Labor Scarcity Changes the Capital You Should Reserve
37% of franchisor executives identified labor availability, quality, and cost as their top business challenge in 2025; 70% reported that franchisees still had unfilled positions; and 56% said labor challenges constrained growth (2025 franchisor survey).
Those responses challenge the assumption that satisfying Item 7 establishes sufficient capitalization. A franchisee can fund the disclosed opening range yet lack the cash required for premium wages, prolonged vacancies, or replacement management.
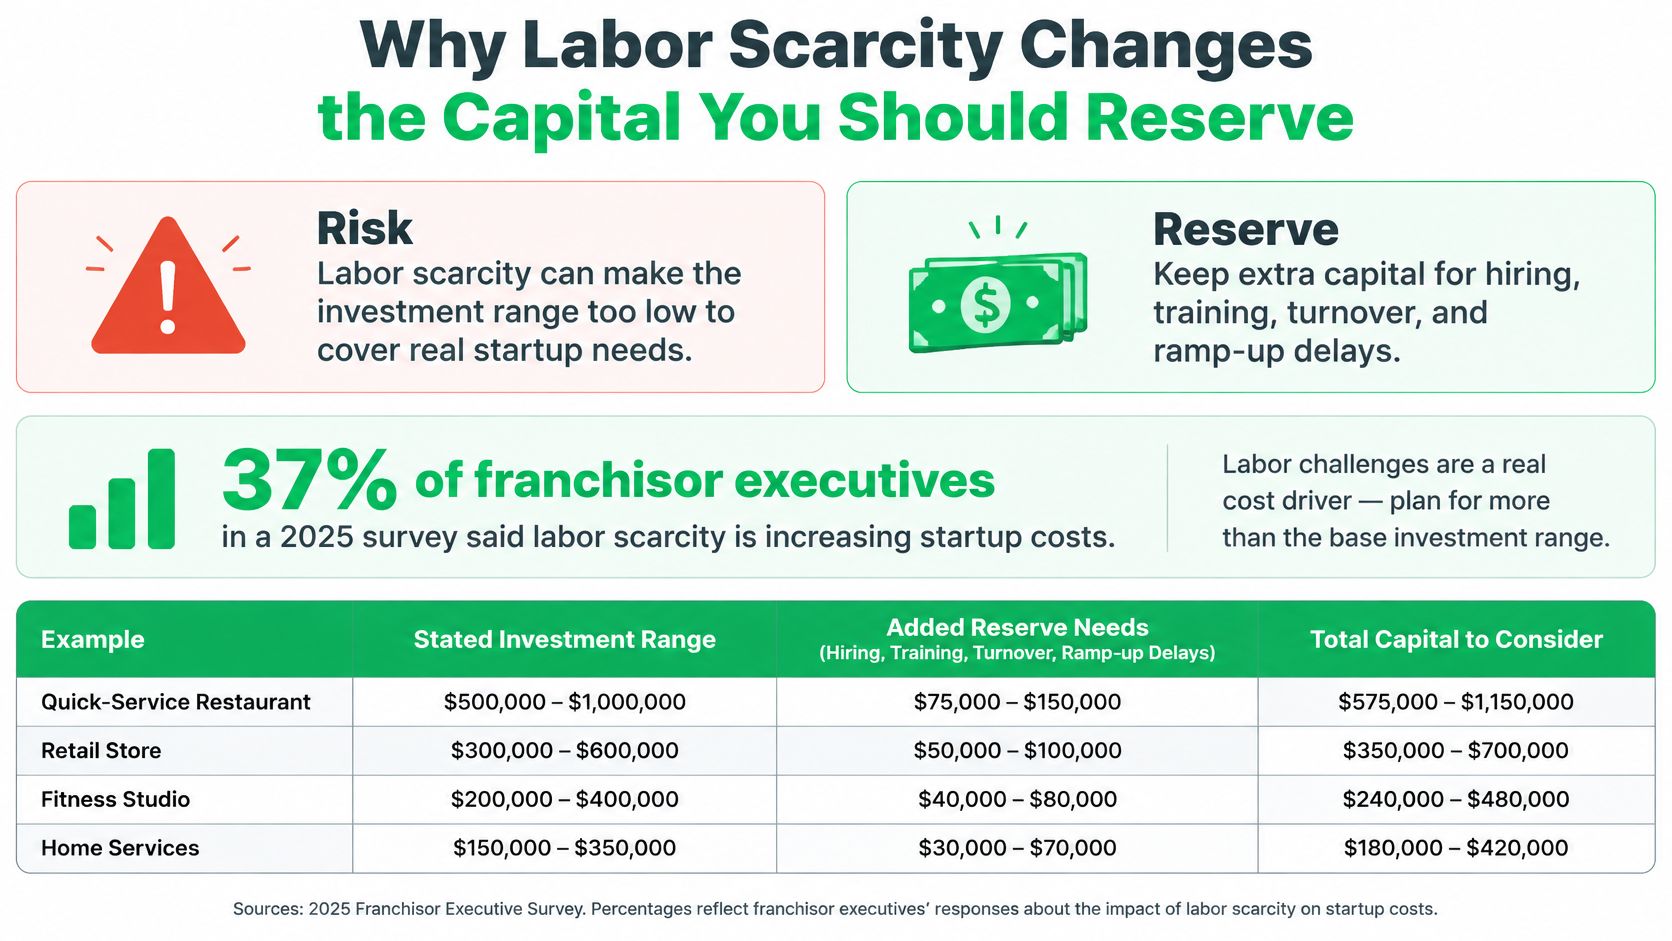
Convert Staffing Assumptions Into Reserve Requirements
The analyst should construct the staffing schedule by role, required coverage, wage assumption, and vacancy exposure. The reserve calculation should then connect each downside assumption to a cash expense or a revenue limitation, avoiding double counting between the operating forecast and the contingency reserve.
| Labor assumption | Downside test | Reserve implication |
|---|---|---|
| Required staffing by role | A required position remains vacant | Recruiting, training, or temporary coverage |
| Local wage assumption | Hiring requires higher compensation | Additional payroll during ramp-up |
| Manager availability | A manager leaves before stabilization | Replacement search and overlapping coverage |
| Owner participation | The owner must replace paid labor | Separate household liquidity assessment |
| Operating coverage | Staffing limits service capacity | Cash required during delayed revenue generation |
For QSR, home services, senior care, and health and beauty, the analyst should verify the actual staffing model rather than apply a uniform reserve percentage. The relevant inputs are the concept's required roles, local wage evidence, expected vacancy duration, overtime exposure, and management substitution plan.
Semi-Absentee Economics Need a Replacement-Labor Test
A semi-absentee ownership proposal should include a fully costed manager-operated case. If the model becomes viable only when the franchisee performs unpaid management work, the analysis should identify that dependence explicitly.
Reserve rule: The relevant cash buffer is the funding required under the adverse staffing case, after accounting for the operating reserve already included in the model.
The owner's personal income needs should remain separate from location expenses but visible in the liquidity assessment. A development team can't treat household funding pressure as irrelevant when that pressure could force early distributions from an underperforming unit.
For brand presidents, the conclusion is operational: labor resilience belongs in franchisee financial qualification. Item 7 establishes the disclosed starting point; the staffing downside determines whether the proposed owner can sustain the business when that starting point proves insufficient.
What Item 20 Churn and Default Rates Reveal About a Brand
Item 20 provides outlet and franchisee-turnover information that analysts can use to distinguish footprint expansion from ownership replacement. New openings should be compared with terminations, non-renewals, transfers, reacquisitions, and ceased operations, rather than evaluated as an isolated growth total (FTC guidance on examining franchise disclosure documents).
A transfer isn't automatically a failed unit, and a new opening doesn't establish durable ownership. For established systems, Item 20 should prompt investigation into the circumstances behind outlet changes, including whether an experienced operator expanded or another franchisee exited.
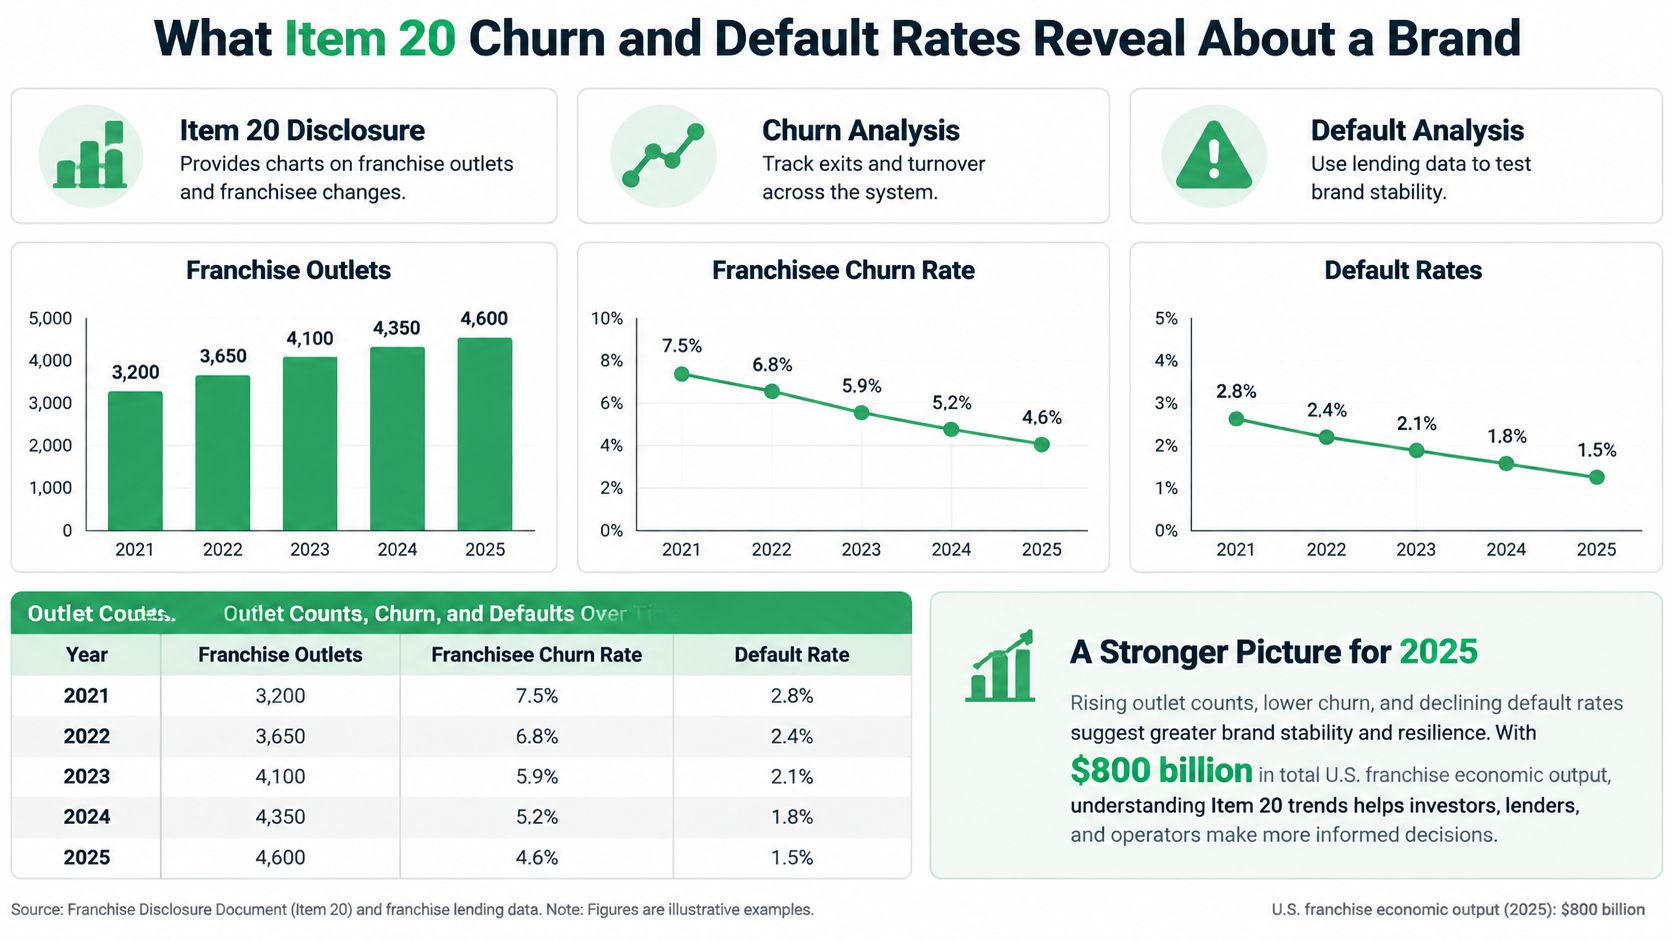
The lending evidence below is a period-based comparison, not evidence of a declining default trend over time.
FTC Lending Evidence Shows Brand-Level Variation
An FTC staff analysis covered 66,291 SBA-backed franchise investment loans from January 1, 2013, through September 30, 2023. Franchise borrowers had a 3.9% default rate, compared with 3.5% for non-franchise small-business borrowers; most franchise brands had rates of 1% or less, while reported outliers included Dickey's Barbecue Pit at 20%, Edible Arrangements at 9%, and Massage Envy at 8% (FTC Franchise Issue Spotlight).
The same FTC publication discusses an earlier GAO review of 170 selected SBA-guaranteed franchise loans approved from 2000 through 2011, of which 74 defaulted. That sample wasn't representative of all franchises; 55 defaults came from four lenders, where 55 of 88 reviewed loans, or 63%, defaulted.
These findings support brand- and lender-specific inquiry, not a universal franchise failure estimate. Loan defaults, outlet closures, and franchisee transfers measure different events and shouldn't be combined into a single success rate.
Survival Benchmarks Require a Different Denominator
Publicly cited establishment benchmarks indicate approximately 49% survive at least five years, 34% at least ten years, and 26% at least fifteen years. Those figures describe establishments broadly and don't prove that franchising is safer or riskier than independent ownership (IFA discussion of business-survival benchmarks).
For analysts measuring franchise performance beyond headline numbers, the practical checks are distinct:
- Reconcile Item 20 events: Compare openings, closures, transfers, and ceased operations.
- Validate with operators: Interview current and former franchisees listed in Item 20 about staffing, owner hours, vendors, and territory performance.
- Normalize management costs: Separate owner-operated results from manager-operated economics.
Building Your Franchise Diligence Sequence
Items 5 through 7, Item 19, and Item 20 should produce an approval record, not separate summaries filed after the development decision. Each analytical output should either support the proposed capital commitment or identify an unresolved condition.
The recommended sequence begins with the payment schedule, proceeds through location economics and labor-adjusted liquidity, and ends with ownership-retention evidence. Item 21 financial statements should remain a separate franchisor-level review rather than be treated as evidence of franchisee profitability.
Turn FDD Analysis Into Approval Gates
| Diligence gate | Required output | Condition requiring further work |
|---|---|---|
| Items 5 through 7 | Classified capital and payment schedule | Unfunded or unclassified obligations |
| Item 19 | Assumption register and location model | Unsupported earnings assumptions |
| Labor-adjusted liquidity | Downside funding assessment | Insufficient cash for the staffing case |
| Item 20 | Outlet-event reconciliation and interviews | Unexplained turnover or inconsistent operator accounts |
| Expansion readiness | Management and capital-allocation assessment | Growth dependent on unresolved operating weaknesses |
A franchise due diligence checklist for investors can organize document collection, but development leadership should assign responsibility for resolving exceptions. Legal, finance, operations, and development teams should record which assumptions they reviewed and which conditions remain open.
For category benchmarking, analysts can use the FDD database and franchise directory as comparison resources alongside the actual disclosure documents. Comparisons across QSR, home services, health and beauty, retail, and senior care should preserve differences in disclosure populations and cost coverage.
Separate Recruitment Measurement From Ownership Underwriting
Development-channel analysis requires its own evidence. Verified outbound, franchise portals, Meta and Google advertising, and broker referrals should be compared using consistently defined cost per qualified conversation, not unsupported assumptions about channel superiority.
For a separate website-acquisition review, Expressify AI's check your website traffic resource can sit alongside the team's traffic assessment. Website activity shouldn't substitute for verified investment capacity, management readiness, or an Item 19-supported financial discussion.
The final approval record should distinguish funded capital, modeled resilience, and verified operating capability. That distinction gives brand presidents a defensible basis for territory awards and expansion decisions without confusing recruitment volume with franchisee readiness.
Franchise Fast Track offers franchise development support and franchise-industry intelligence resources for established U.S. brands. Development executives can visit Franchise Fast Track and use its FDD database and franchise directory to begin comparing disclosed investment requirements, financial performance representations, and outlet turnover before the next territory approval.
Ready to see results like these for your franchise?
Stop wasting money on leads that never close. Start getting hundreds of replies from high-net-worth professionals daily.