Average Unit Volume for Franchise Valuation and Growth
A franchise system's highest-volume locations can still lose money, so a larger average unit volume doesn't establish a stronger investment case. The FTC's franchise finance guidance explicitly distinguishes sales from earnings and warns that rent, labor, overhead, and other expenses can absorb a high-sales outlet's revenue.
Table of Contents
- Why Average Unit Volume Is Not Profitability
- Calculating Average Unit Volume From FDD Data
- Reading AUV Across FDD Disclosure Sections
- Benchmarking AUV Across Franchise Categories
- What a Public Company AUV Disclosure Reveals
- Why a Mean Can Hide the Unit Distribution
- Applying AUV to Valuation and Territory Planning
- A Final Framework for Development Decisions
Why Average Unit Volume Is Not Profitability
Average unit volume measures sales scale, not owner cash flow, EBITDA, or return on invested capital. For established franchise systems, the analytical question isn't whether a location generates substantial revenue. It's whether the operating model converts that revenue into sufficient cash after expenses and capital requirements.
An investment committee should therefore treat AUV as the beginning of an economic bridge, not its conclusion. Revenue must be reconciled with cost of goods sold, labor, occupancy, royalties, marketing fees, and other operating expenses before analysts can assess four-wall profitability. Debt service, taxes, and additional investment requirements then affect the cash available to ownership.
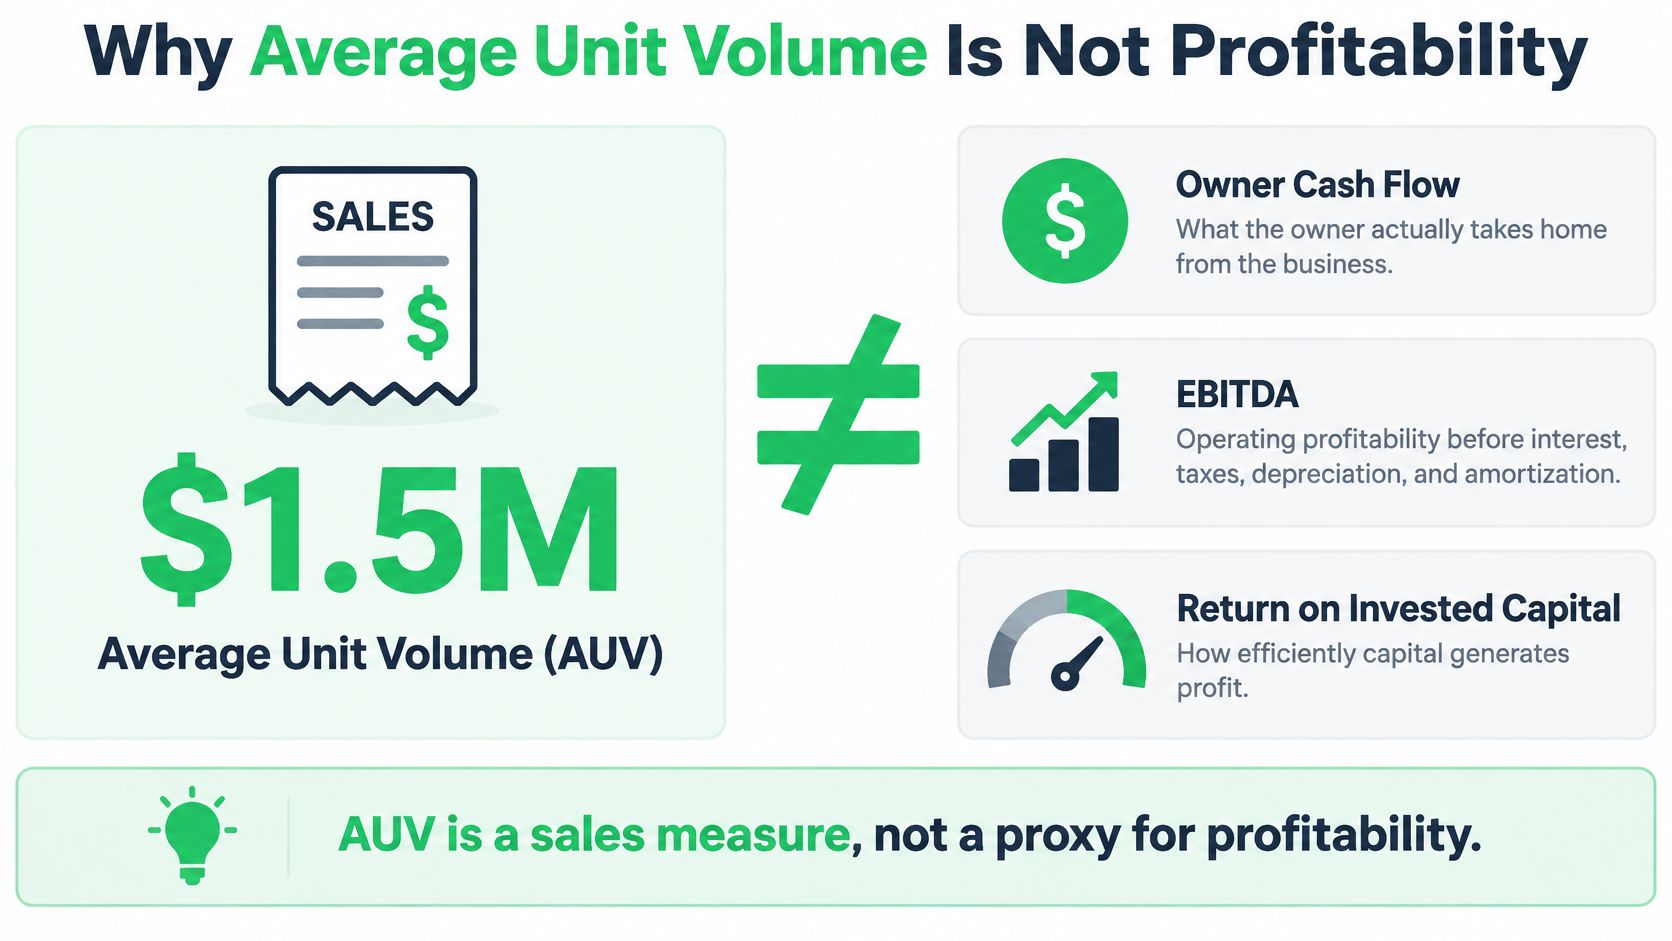
The infographic's sales amount is illustrative, not a disclosed brand benchmark. Its relevant distinction is structural: the top line and the investment return measure different things.
The Cash-Flow Bridge Behind the Sales Figure
A development executive assessing expansion should separate revenue capacity from operating efficiency and capital intensity. A location can support substantial sales while requiring expensive real estate, extensive staffing, or significant reinvestment. Another format may generate less revenue but retain more cash relative to the capital committed.
Investment discipline: AUV establishes the sales denominator. It doesn't establish the margin or the return on that denominator.
For a conceptual companion, Finzer's unit economics explained for investors provides a useful resource alongside a franchise-specific operating model. The practical application belongs in franchise earnings analysis methods, where sales are connected to the expenses and investment requirements that determine earnings.
The implication for valuation is direct: analysts shouldn't assign a stronger economic assessment merely because a brand reports a larger sales average. They should first identify what remains after the costs of producing those sales.
Calculating Average Unit Volume From FDD Data
AUV = Total unit volume for the defined population ÷ Number of units in that population.
Sonic's Item 19 methodology defines unit volume as gross sales, adds the volumes of the applicable restaurant group, and divides that total by the number of restaurants in the group. The words applicable restaurant group carry as much analytical weight as the arithmetic.
A franchised-only average answers a different question from a company-operated average. A mature-unit average describes established operations, while an all-open-unit average can include locations that contributed only part of the measurement period.
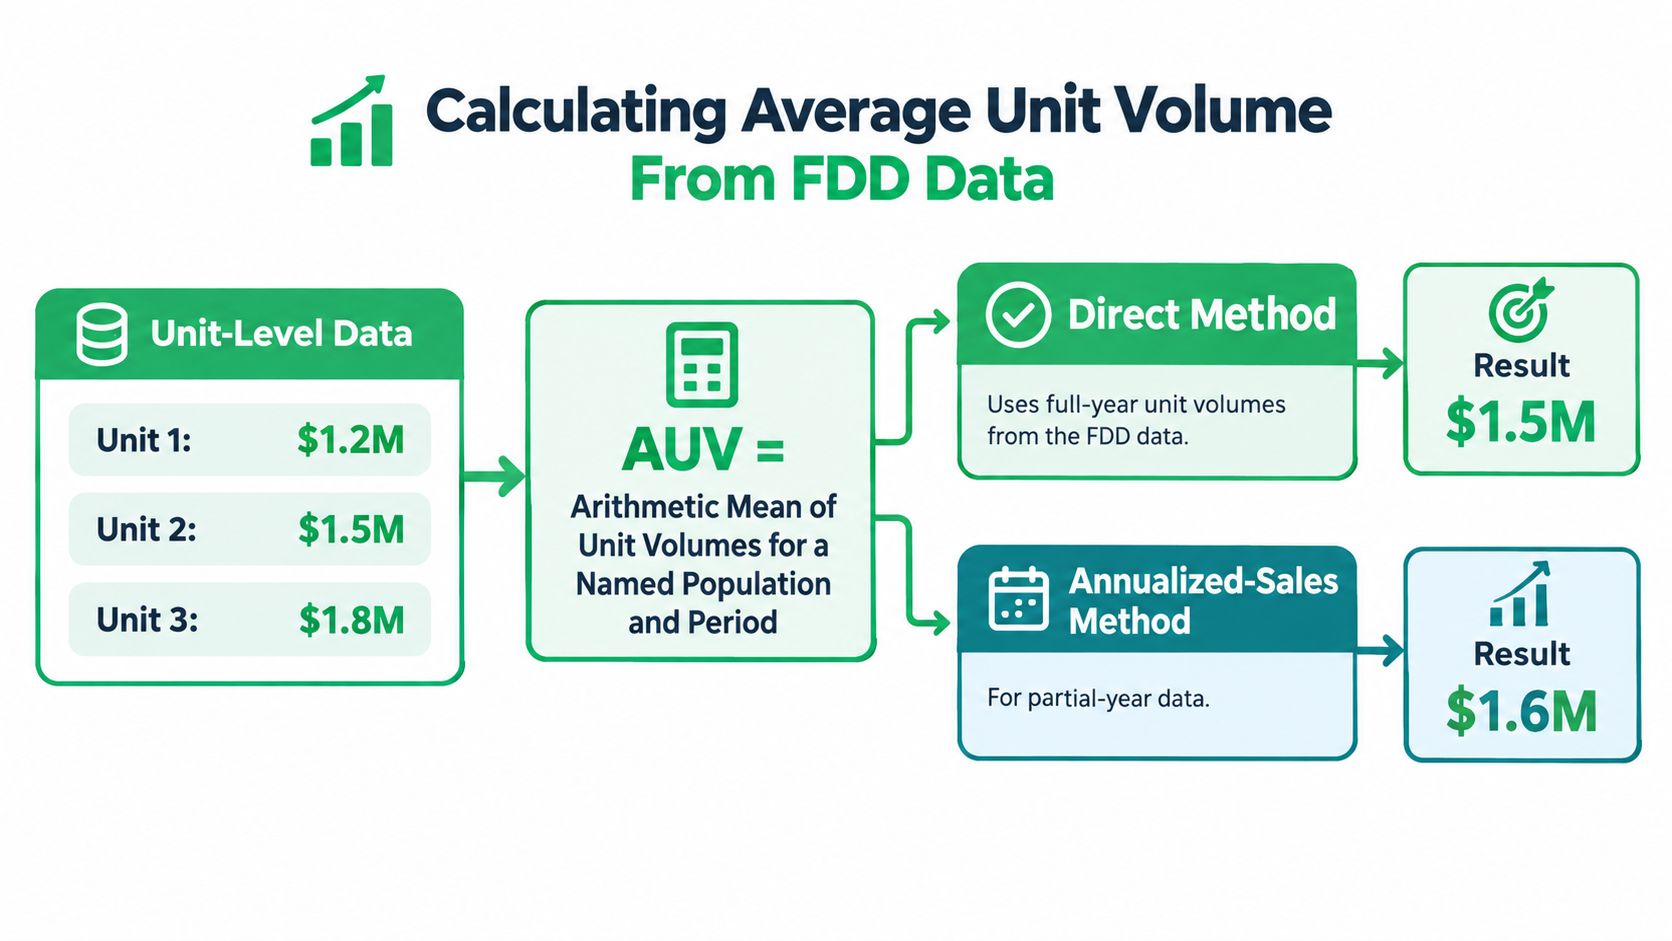
The unit amounts in the diagram illustrate arithmetic rather than reported franchise results. In a disclosure model, every input should instead trace to the relevant reporting population and fiscal period.
Direct Means and Annualized Sales Answer Different Questions
A direct mean uses the recorded sales of each included unit. An annualized-sales convention instead follows this structure:
Annualized sales = Revenue during the measurement period ÷ Operating days during that period × Operating days in a typical year.
The public-company disclosure examined below uses operating-day normalization. That approach adjusts for measurement-period length, but an analyst still needs to establish whether the reported figure is an average of unit results or a calculation based on aggregate revenue and operating days. The methods shouldn't be assumed interchangeable.
| Calculation component | What the analyst records | Why it matters |
|---|---|---|
| Sales numerator | Gross sales, revenue, or another disclosed measure | Different definitions can produce different totals |
| Unit denominator | The exact included restaurant or outlet group | Ownership and maturity determine comparability |
| Measurement period | Actual fiscal dates and operating-day convention | Partial periods require explicit treatment |
| Exceptions | Closures, reduced hours, missing reports | Exclusions change the population represented |
A symbolic worked example makes the denominator visible without inventing a benchmark. For a mature franchised cohort, the analyst adds sales from every eligible reporting location and divides by the count of those same locations. If recently opened locations are excluded from the numerator, they must also be excluded from that denominator.
The strategic error occurs when a development model substitutes a different population without changing the label. A mature-unit result can describe the established estate accurately while saying little about the sales trajectory of newly awarded territories. A mathematically correct average can still answer the wrong investment question.
Reading AUV Across FDD Disclosure Sections
Item 19 is optional, but the disclosure obligation isn't optional when a franchisor makes covered financial performance representations. The FTC Franchise Rule Compliance Guide requires a reasonable basis, written substantiation, and Item 19 disclosure for representations about specific sales, income, gross profit, or net profit.
That makes Item 19 the starting point for evidence extraction, not a substitute for reviewing the rest of the FDD. Initial investment, outlet turnover, and financial statements address different parts of the underwriting question.
AUV Evidence Across FDD Sections
| FDD Section | What It Shows | Decision Supported |
|---|---|---|
| Item 7 | Estimated initial investment | Whether the sales model is being assessed against the required capital |
| Item 19 | Financial performance representations and supporting methodology | Whether the revenue benchmark has an identifiable basis |
| Item 20 | Outlets and franchisee turnover | Whether the reporting population reconciles with system development and exits |
| Item 21 | Financial statements | Whether the franchisor's financial position supports the broader assessment |
These sections shouldn't be collapsed into a single earnings narrative. Item 21 financial statements concern the disclosed reporting entity; they don't automatically establish franchisee-level profitability. Similarly, the investment estimates in Item 7 aren't evidence that a particular revenue level will produce an acceptable return.
The FDD due diligence insights provide a complementary framework for reading those sections together rather than extracting a headline sales figure in isolation.
AUV evidence is only auditable when another analyst can reconstruct both the reported population and the calculation.
Operating Status Requires Its Own Field
Some reporting conventions exclude temporarily closed locations while retaining locations operating with reduced hours, as the public-company example below illustrates. Those treatments answer different questions: exclusion removes an observation, while inclusion can preserve the sales effect of restricted operations.
A research file should therefore distinguish unit eligibility from operating conditions. The extraction record needs the source document, reporting dates, ownership group, maturity rule, sales definition, and treatment of exceptional operating statuses.
For an investment committee, the practical deliverable is a traceable evidence record. The record should explain what the figure measures before the committee decides what it means.
Benchmarking AUV Across Franchise Categories
The FRANdata and International Franchise Association outlook projected 2025 U.S. franchising output of approximately $936.4 billion across about 851,000 establishments. At that scale, a universal revenue threshold would combine operating models that shouldn't share a valuation screen.
For established systems, category membership is only the first filter. Analysts also need ownership type, operating tenure, format, and an equivalent sales definition before treating reported averages as comparable.
Comparable AUV Categories
The following matrix specifies questions for benchmark construction, not category revenue estimates.
| Franchise Vertical | Unit Cohort Required | Format and Territory Context |
|---|---|---|
| Quick-service restaurants (QSR) | Comparable ownership and maturity groups | Restaurant format, operating hours, and trade area |
| Home services | Comparable territory tenure | Service radius, delivery model, and staffing structure |
| Real estate brokerages | Offices using equivalent revenue definitions | Office model and geographic market |
| Fitness and wellness | Established locations separated from opening cohorts | Facility format, capacity, and catchment area |
| Automotive services | Comparable service formats and operating tenure | Site configuration and service territory |
| Health and beauty | Comparable location formats | Staffing model, service capacity, and local market |
| Retail | Comparable store types and maturity | Footprint and trade-area characteristics |
| Education | Comparable operating calendars and location tenure | Delivery format, capacity, and territory |
| Senior care | Comparable service models and territory tenure | Service geography and labor model |
The matrix prevents an analyst from treating the word unit as a standardized economic asset. A service territory, brokerage office, and restaurant location need separate definitions before their reported volumes can support a comparative model.
Mature-Unit Benchmarks Shouldn't Replace Opening Cohorts
A development team should maintain distinct views of established operations and the expanding estate. Mature-unit AUV can inform the revenue potential of an established format, while opening cohorts help assess the path required to reach that condition.
Blending those populations can obscure the distinction between operating performance and system composition. Conversely, removing newer locations from every presentation can leave an expansion model without evidence about ramp-up.
Franchise Fast Track territory research is a complementary planning resource when translating category analysis into geographic screening. The committee's comparison should still rest on the actual disclosed cohort rather than a broad category label.
The appropriate output isn't a league table sorted by sales. It's a set of comparable groups, each with an explicit explanation of which development decisions the evidence can support and which questions remain unanswered.
What a Public Company AUV Disclosure Reveals
A 2022 SEC-filed restaurant disclosure reported approximately $1.421 million in company-owned AUV for the second quarter, an increase of 5.3% from the same quarter in 2021 and 18.3% from the comparable quarter in 2019; reported franchise AUV was approximately $1.276 million. These are annualized sales measures reported for the quarter, not the sales each restaurant necessarily collected during that quarter.
The distinction matters because a committee could otherwise confuse the reporting window with the duration represented by the normalized figure. Annualization puts the sales observation on a common operating-day basis without converting it into an earnings measure.
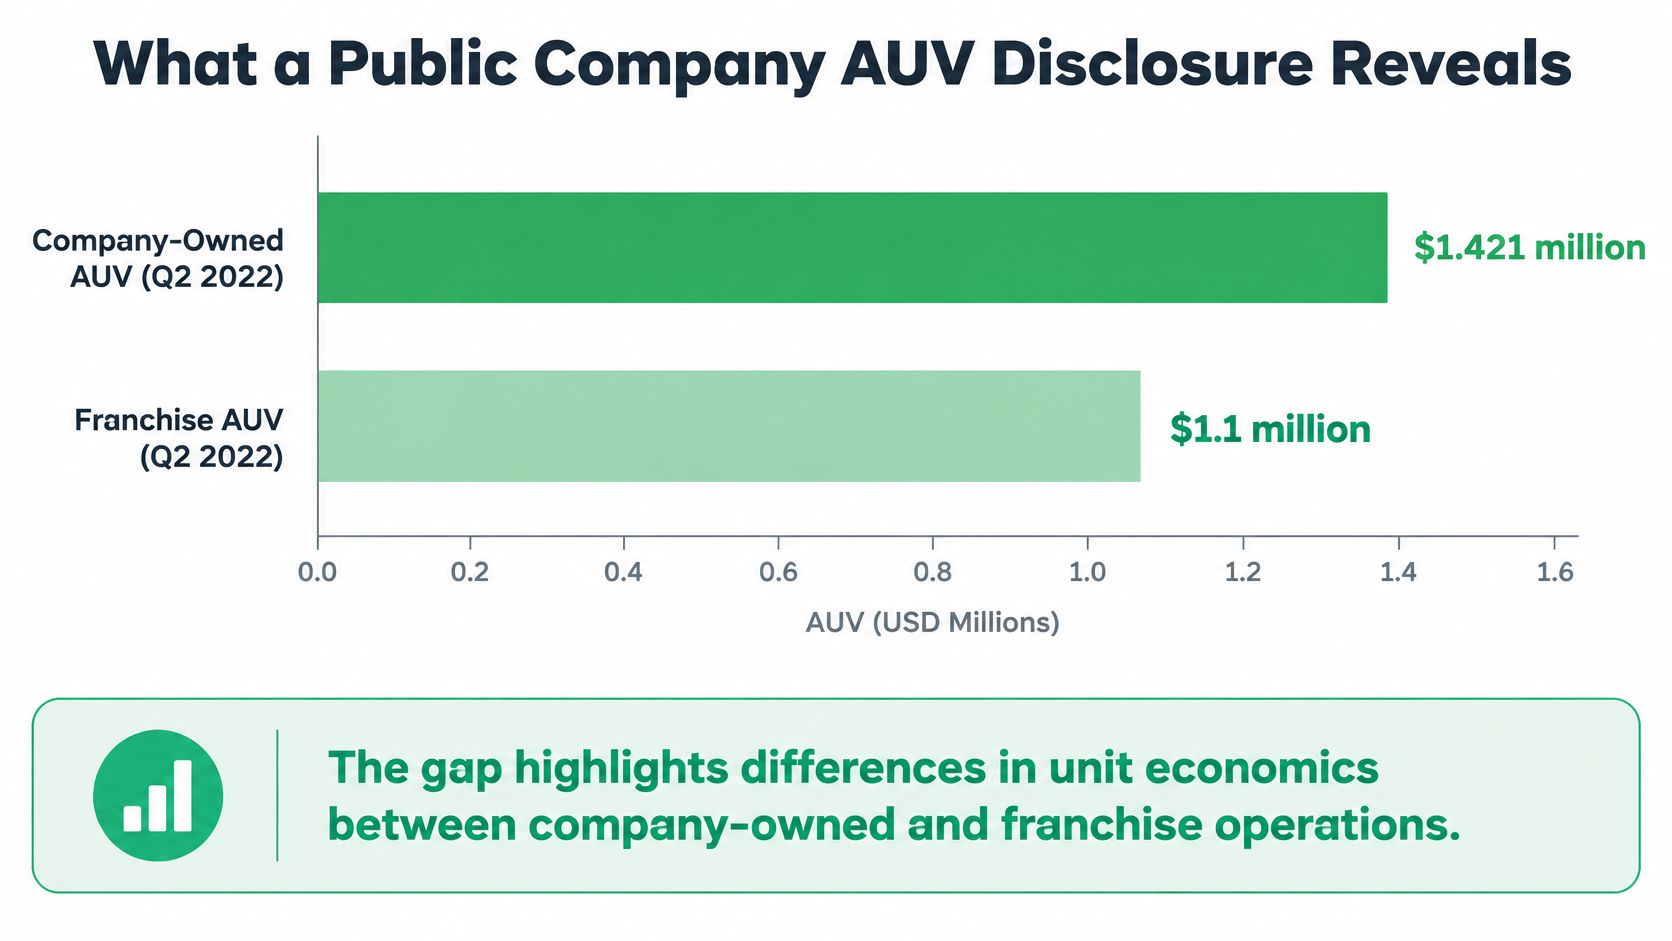
The filing's franchise figure in the preceding paragraph governs the comparison; the graphic's franchise label is inconsistent with that disclosure. Neither the ownership-group gap nor the chart establishes a difference in profitability.
What the Filing Supports
The disclosed results support an observation about revenue scale and movement across the specified comparison periods. They also support separating company-operated and franchised restaurants rather than treating the estate as economically homogeneous.
They don't, by themselves, explain the ownership-group difference. Geography, restaurant age, format, hours, and operating conditions require separate examination. Occupancy, labor, and franchise fees then belong in the profitability reconciliation rather than being inferred from sales.
For analysts combining public disclosures, Artul.ai's resource on evidence-based market signals from filings offers a complementary research reference. The governing discipline remains document-specific: the calculation, reporting population, and caveats should remain attached to the figure.
Committee interpretation: Operating-day normalization improves the comparison of sales periods. It doesn't make locations economically identical.
A valuation model can use the disclosed AUV as an anchor for revenue assumptions. It should not use the ownership-group difference as a margin assumption, or extend the historical growth comparison into an undeveloped territory without additional evidence.
Why a Mean Can Hide the Unit Distribution
An accurate arithmetic mean can still describe a result that most locations don't achieve. A small group of unusually high-volume units can pull the average above the center of the distribution.
The NASAA Item 19 commentary addresses that problem by requiring the corresponding median whenever an average is disclosed and the highest and lowest figures when the average concerns gross sales. Those disclosures help analysts distinguish a broad operating result from a mean influenced by exceptional locations.
Reporting Coverage Is Different From Performance Dispersion
The analyst must also establish how much of the system the table represents. Item 19 guidance on reporting populations identifies the need to disclose the measured population, actual reporting outlets, and the number and percentage achieving the stated performance, including an explanation when a subset is used.
| Evidence | Analytical question |
|---|---|
| Median relative to mean | Is the headline average above the central location result? |
| Highest and lowest sales | How broad is the disclosed range? |
| Share achieving the stated result | How common is the headline performance? |
| Reporting population relative to the system | How representative is the sample? |
| Bottom-quartile results, when available | What does weaker-cohort underwriting imply? |
Coverage and dispersion aren't interchangeable. A complete reporting sample can still contain widely dispersed outcomes. A narrow sample can show tightly grouped results while omitting locations material to the development thesis.
Survivorship Changes the Question
An established-location screen can improve comparability while excluding early-stage operations or locations that closed before qualifying. That doesn't automatically invalidate the reported average, but it narrows the conclusion the analyst can draw.
The review of franchise success rate for franchisors belongs alongside this analysis, not inside the AUV calculation. Outlet continuity and sales performance describe different outcomes.
The committee should distinguish a strong surviving cohort from evidence that the entire development program performs similarly. Where exclusions remove the very locations most relevant to expansion risk, the missing cohort needs separate analysis rather than an optimistic assumption.
Applying AUV to Valuation and Territory Planning
A decision-ready benchmark needs a documented identity. FDDIQ's Item 19 analysis guidance recommends recording the source FDD year, fiscal-period definition, unit population, inclusion and exclusion rules, and whether the measure represents gross sales, revenue, or another basis.
That record provides the control layer for valuation and territory work. Analysts can then distinguish a sourced historical observation from an assumption introduced into the investment model.
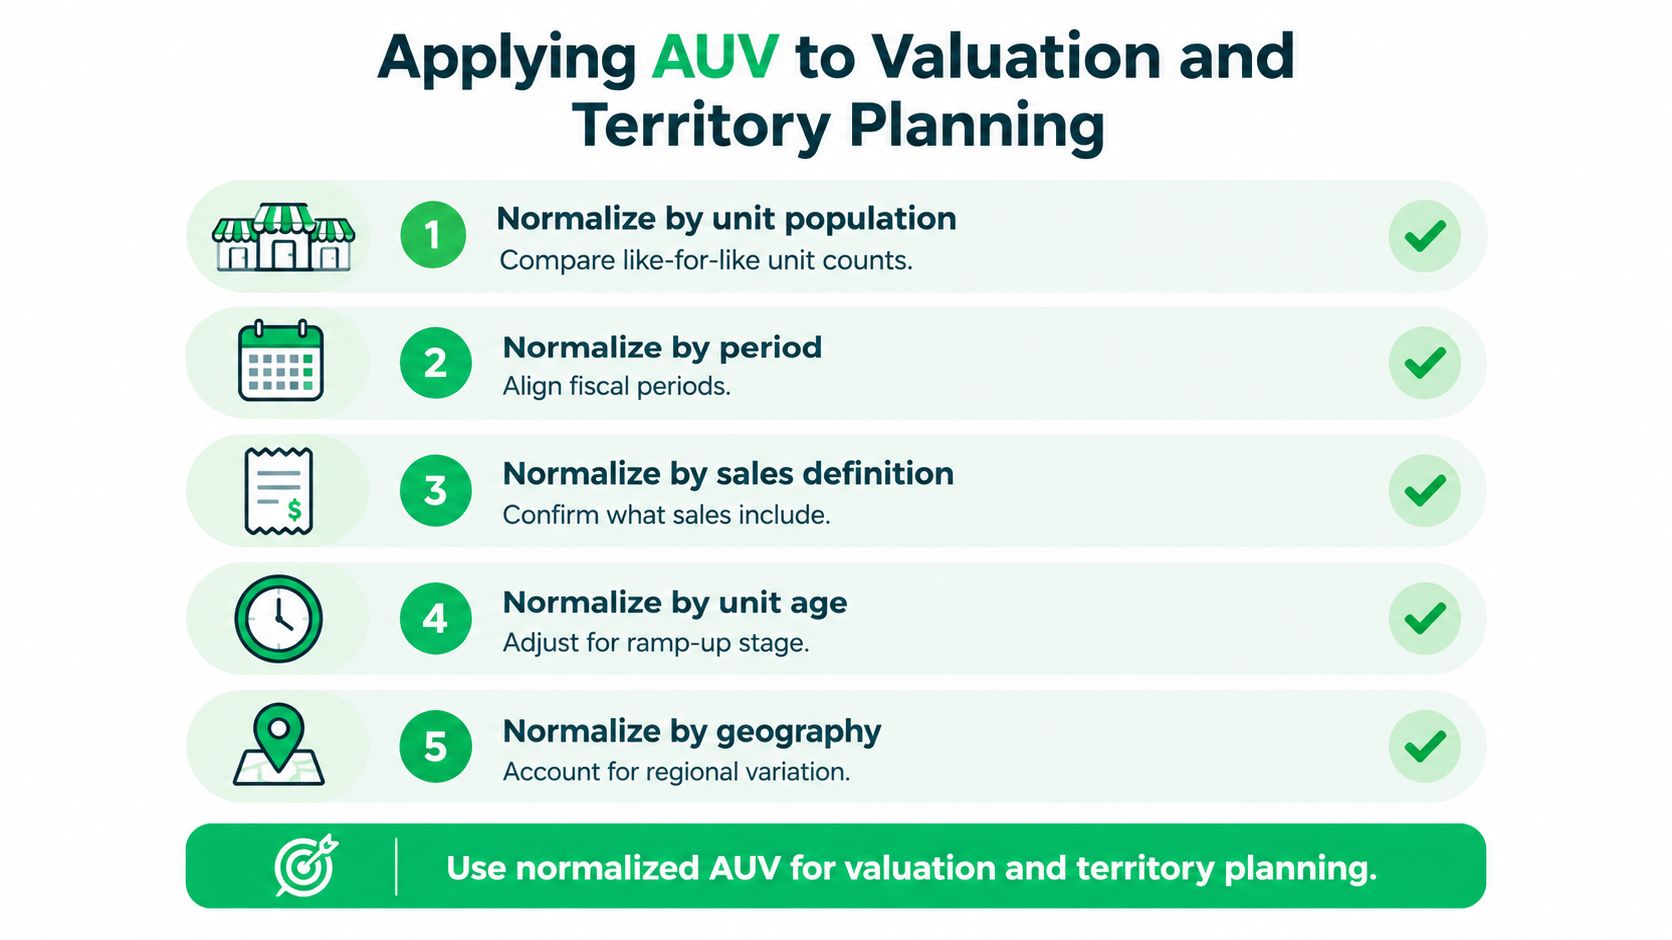
Decision Checks for AUV
| Validation Check | Decision Question | Supporting FDD Evidence |
|---|---|---|
| Population alignment | Does the benchmark represent the proposed operating model? | Item 19 cohort definitions |
| Capital requirements | What investment must the projected economics support? | Item 7 investment estimates |
| Operating economics | Which costs are disclosed, and which require separate substantiation? | Item 19 financial performance detail |
| System continuity | Are exits and openings consistent with the growth thesis? | Item 20 outlet and turnover disclosures |
| Financial capacity | What does the franchisor's financial position indicate? | Item 21 financial statements |
| Territory fit | Does the intended market resemble the reported cohort? | Item 19 limitations and geographic context |
After those checks, analysts should model the intended territory rather than transplant the systemwide mean. Local occupancy, staffing, demographic fit, and site or service format should enter as explicit assumptions supported by separate research.
The Franchise Fast Track territory mapping guide provides a planning reference for that geographic assessment. Mapping doesn't validate an AUV assumption by itself; the territory must still match the relevant operating and sales evidence.
Separate Observation From Underwriting
An investment memorandum should label historical disclosed performance, normalization adjustments, and forward assumptions separately. Where same-store results, closure information, or pipeline detail are available, they should test the growth case rather than disappear into a blended forecast.
The resulting scorecard needn't manufacture precision. A missing cost schedule or unmatched territory is a reason to condition the decision, not a reason to fill the gap with the brand average.
A Final Framework for Development Decisions
AUV should pass an evidence hierarchy before it enters a valuation, recruitment, or expansion decision. An impressive sales figure isn't sufficient if the underlying location group doesn't resemble the units the organization intends to develop.
The investment committee's judgments should proceed in order. Normalization comes before comparison, population completeness before representativeness, and operating economics before any conclusion about investment quality.
The Approval Sequence
- Normalize the observation. Confirm that the sales definition, measurement period, ownership group, maturity rule, and format match the proposed comparison. If they don't, retain separate benchmarks.
- Reconcile the population. Identify missing reporters, excluded locations, and exceptional operating statuses. Determine whether the omissions matter to the intended growth strategy.
- Test the distribution. Assess whether the median, range, and available lower-performing cohorts support the headline result. A mean without distributional context should remain a preliminary screening input.
- Establish the cash conversion. Connect the sales case to substantiated operating costs, capital requirements, and the distinction between location-level cash generation and ownership-level returns.
- Match the territory. Require evidence that the proposed geography and operating format resemble the relevant historical cohort. Otherwise, underwrite the differences explicitly.
The less obvious conclusion is that a lower-AUV concept can be economically stronger. If its occupancy and labor model retain more operating cash relative to required investment, the smaller revenue base can support a more attractive economic outcome. That conclusion must come from the cash-flow model, not from reversing the sales ranking and assuming lower volume is preferable.
Research Infrastructure Is Not a Substitute for Judgment
FDD repositories, public-company filings, and internal operating records serve different purposes. A repository helps locate comparable disclosures, a filing supplies a specific reported observation, and operating records can help explain the economics beneath it.
Development leaders should require the analyst to preserve those distinctions through the final recommendation. The committee should be able to identify the disclosed fact, the adjustment, the remaining uncertainty, and the decision each supports.
For further document-level comparison, the searchable FDD database offers a starting point for assembling source disclosures. The objective is a defensible cohort benchmark, not a brand-ranking score.
Franchise Fast Track is a franchise development partner and emerging intelligence platform with a structured registry of more than 7,000 franchise brands and a searchable database of more than 68,000 FDDs. Development executives and investment teams can visit the platform to begin comparing Item 19 methodologies, reporting populations, and distribution evidence before incorporating average unit volume into their next territory or valuation model.
Ready to see results like these for your franchise?
Stop wasting money on leads that never close. Start getting hundreds of replies from high-net-worth professionals daily.