How Franchise Profitability Is Calculated: 2026 Guide

Franchise profitability is calculated by subtracting all operational expenses, royalties, advertising contributions, and cost of goods sold from total gross revenue to produce net profit at the unit level. This calculation is not a single formula but a layered financial analysis that starts with gross sales, strips out mandatory franchisor fees, accounts for every operating cost category, and arrives at owner earnings through metrics like net profit margin, Seller's Discretionary Earnings (SDE), or EBITDA. Understanding how franchise profitability is calculated separates investors who make confident decisions from those who mistake top-line revenue for actual income. The Franchise Disclosure Document (FDD) Item 19 is the official starting point for this analysis, though it rarely tells the full story on its own.
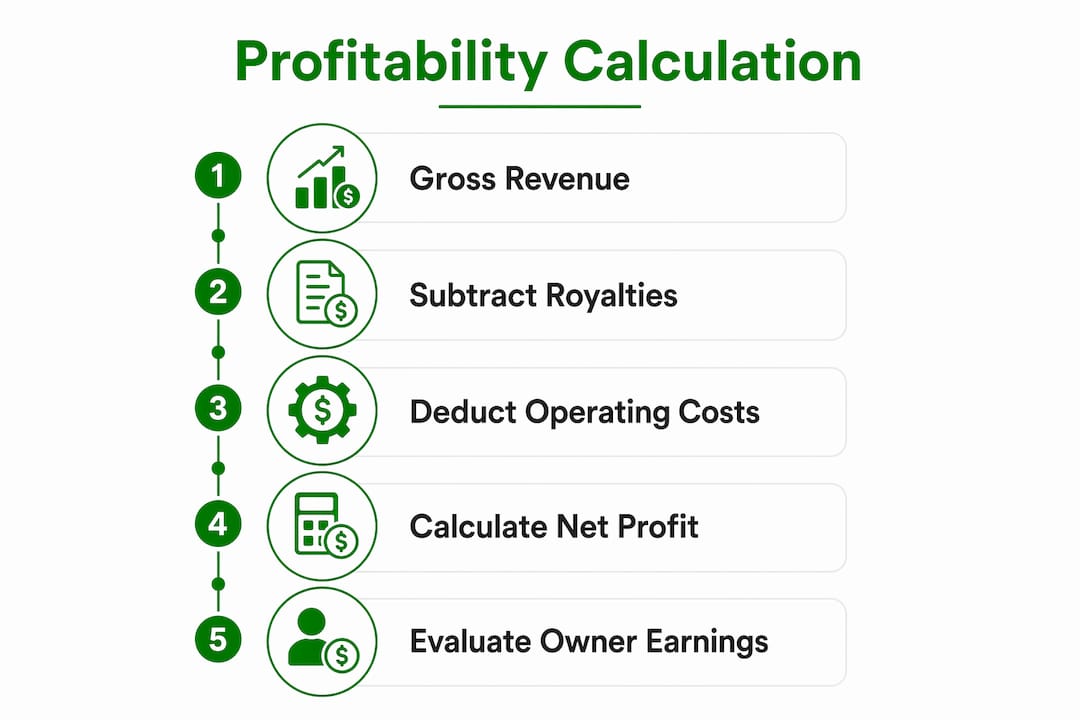
How franchise profitability is calculated from revenue to net profit
Gross sales, also called Average Unit Volume (AUV), represent the total revenue a franchise location generates before any expenses are deducted. AUV is the number most franchisors lead with in sales conversations, and it is the number most prospective buyers misread as profit. A franchise reporting $1.2 million in gross sales could yield anywhere from $60,000 to $300,000 in net income depending on its cost structure, which is why gross sales alone are misleading without a full expense model behind them.
The first mandatory deductions from gross revenue are franchisor fees. Royalty fees typically range from 4% to 8% of gross sales, and advertising fund contributions add another 1% to 3% on top. On a $1.2 million revenue unit, that means $60,000 to $132,000 leaves the business before a single employee is paid or a utility bill is covered. These fees scale linearly with sales, so higher revenue does not automatically translate to proportionally higher profit.

After franchisor fees, the remaining revenue pool covers all operating expenses: labor, rent, cost of goods sold (COGS), utilities, and insurance. What remains after all of these deductions is net profit. The net profit margin formula is net profit divided by total revenue, expressed as a percentage. A franchise generating $1.2 million in gross sales with $1.08 million in total costs produces a net profit of $120,000 and a net profit margin of 10%.
What revenue components and fees affect franchise profitability?
Franchisor fee structures vary significantly by industry and brand, and those differences compound over time. Quick-service restaurant franchises like McDonald's or Subway carry royalty structures at the higher end of the range, while service-based franchises in categories like pest control or home services often sit at the lower end. The fee schedule is disclosed in the FDD, specifically in Items 6 and 7, and it is non-negotiable once you sign the franchise agreement.
Beyond royalties and advertising contributions, some franchisors charge technology fees, training fees, and required purchasing markups through approved supplier networks. These costs do not always appear in Item 19 financial disclosures, which means a buyer reading only the revenue data misses a meaningful portion of the true expense picture. Franchisee forums and real franchisee data from verified operators are often the only way to surface these hidden cost layers before signing.
Fee structures also behave differently depending on revenue volume. Royalties and advertising fund fees scale linearly with sales, while costs like technology subscriptions remain fixed regardless of how much the location earns. This distinction matters when modeling profitability across different revenue scenarios.
- Royalty fees: 4% to 8% of gross sales, paid to the franchisor monthly
- Advertising fund contributions: 1% to 3% of gross sales, pooled for brand marketing
- Technology and software fees: fixed monthly charges, typically $200 to $1,500
- Required supplier markups: embedded in COGS, often 3% to 8% above open-market pricing
- Training and renewal fees: one-time or periodic charges disclosed in FDD Items 5 and 6
Pro Tip: Review the franchisor's complete fee schedule across FDD Items 5, 6, and 7 before modeling profitability. Missing even one recurring fee category can shift your net margin projection by 2 to 4 percentage points.
How to account for operating expenses in profitability calculations
Operating expenses beyond franchisor fees fall into three behavioral categories: fixed, semi-variable, and variable. Fixed costs, such as rent and insurance, stay constant regardless of sales volume. Variable costs, such as COGS and credit card processing fees, move in direct proportion to revenue. Semi-variable costs, such as labor, have a fixed floor (minimum staffing) and a variable ceiling (additional staff during peak periods). Separating these categories allows you to stress-test profitability under different revenue scenarios rather than relying on a single static projection.
Here are the major operating expense categories and their typical percentage ranges relative to gross revenue, based on industry benchmarks across food service and service-based franchise models:
- Labor costs: 25% to 35% of gross revenue, the largest variable expense in most franchise categories
- Rent and occupancy: 8% to 12% for retail and food service locations; lower for home-based or mobile franchises
- Cost of goods sold (COGS): 28% to 35% for food franchises; 15% to 25% for service-based models
- Utilities: 2% to 5% depending on equipment intensity and location
- Insurance: 1% to 3%, varying by industry risk profile and state requirements
- Marketing and local advertising: 1% to 2% beyond the required advertising fund contribution
| Expense category | Typical % of gross revenue | Cost behavior |
|---|---|---|
| Labor | 25% to 35% | Semi-variable |
| Rent and occupancy | 8% to 12% | Fixed |
| COGS | 15% to 35% | Variable |
| Utilities | 2% to 5% | Semi-variable |
| Royalties and ad fees | 5% to 11% | Variable |
Gross profit margin is calculated as revenue minus COGS, divided by revenue. For a food franchise with $1.2 million in sales and $390,000 in COGS, gross profit is $810,000 and gross margin is 67.5%. Net profit margin then accounts for all remaining expenses below the gross profit line, including labor, rent, royalties, and overhead. The gap between gross margin and net margin is where most franchise investors are surprised by how much cost lives in that middle layer.
Pro Tip: Build two versions of your expense model: one using the median revenue figure from Item 19 and one using the 25th percentile. If the business is not profitable at the 25th percentile, the risk profile is higher than the average-case scenario suggests.
Which profitability metrics determine franchise net profit and owner earnings?
Net profit and net profit margin are the baseline metrics for measuring franchise profitability, but they are not always the most relevant metrics depending on who is doing the analysis and how the business will be operated. The choice of metric changes the number significantly, and using the wrong one leads to flawed investment decisions.
SDE, or Seller's Discretionary Earnings, adds the owner's salary and personal benefits back to net profit. This metric is the standard for owner-operated franchise units because it reflects the total economic benefit the owner receives, whether paid as salary or retained as profit. SDE is preferred for owner-operated scenarios, while EBITDA, which excludes owner salary and assumes hired management, is the preferred metric for multi-unit investors underwriting with a management layer in place.
Consider a franchise unit with $1.2 million in gross sales and the following simplified financials:
- Gross revenue: $1,200,000
- Total expenses (fees, labor, COGS, rent, overhead): $1,050,000
- Net profit: $150,000
- Owner salary (added back for SDE): $80,000
- SDE: $230,000
- Depreciation and amortization (added back for EBITDA): $20,000
- EBITDA: $170,000 (excluding owner salary, including D&A add-back)
The $60,000 difference between SDE and EBITDA is not an accounting error. It reflects a real operational assumption: will the owner work in the business or hire a manager? Investors should verify whether net income figures in Item 19 include or exclude owner compensation before comparing franchises side by side. Missing this distinction is one of the most common errors in franchise financial analysis.
Multi-unit investors typically underwrite using EBITDA because they assume hired management overhead across all locations. Single-unit owner-operators use SDE because their personal labor is the primary cost not captured in the income statement. Aligning the metric to the operating model is not optional. It is the foundation of an accurate profitability calculation.
How to model franchise profitability and evaluate investment return
Building a franchise profitability model starts with FDD Item 19 data, which is the only legally required source for financial performance representations under the FTC Franchise Rule. However, only 56% of franchisors disclose expenses in Item 19, and just 32% provide full profit and loss statements. That means the majority of buyers must build their own cost models using industry benchmarks and franchisee interviews to fill the gaps.
Follow this sequence to build a working profitability model:
- Pull the median AUV from Item 19 (not the average, which is skewed by top performers)
- Subtract royalty fees (4% to 8%) and advertising contributions (1% to 3%) from gross revenue
- Apply COGS percentage based on the franchise category (15% to 35%)
- Apply labor cost percentage (25% to 35%) based on the operating model
- Add rent, utilities, insurance, and overhead using location-specific estimates
- Calculate net profit and divide by total revenue to get net profit margin
- Add back owner salary to derive SDE, or add back D&A to derive EBITDA
Break-even revenue is calculated as fixed costs divided by one minus the variable cost percentage. If a franchise has $300,000 in fixed annual costs and variable costs represent 65% of revenue, break-even revenue equals $300,000 divided by 0.35, or approximately $857,000. Any revenue above that threshold generates profit.
Payback period is calculated by dividing total initial investment (from FDD Item 7) by annual net profit. A $350,000 investment with $120,000 in annual net profit produces a simple payback of 2.9 years. Cash-flow payback extends this timeline because working capital needs and ramp-up periods in the first 12 to 18 months reduce actual cash available for debt service and owner distributions.
| Metric | Formula | Example result |
|---|---|---|
| Net profit margin | Net profit / Gross revenue | $120K / $1.2M = 10% |
| SDE | Net profit + owner salary | $150K + $80K = $230K |
| Break-even revenue | Fixed costs / (1 minus variable cost %) | $300K / 0.35 = $857K |
| Simple payback period | Total investment / Annual net profit | $350K / $120K = 2.9 years |
Pro Tip: Use tools like franchise financial modeling templates to build scenario models at 75%, 100%, and 125% of median AUV. This range reveals whether the franchise is viable only at peak performance or profitable across a realistic distribution of outcomes.
Key takeaways
Franchise profitability is calculated by layering expense deductions from gross revenue through a structured model that produces net profit, SDE, or EBITDA depending on the operating scenario and investor type.
| Point | Details |
|---|---|
| Start with median AUV, not average | Average revenue in Item 19 is skewed by top performers; median reflects realistic expectations. |
| Franchisor fees reduce revenue first | Royalties (4% to 8%) and ad contributions (1% to 3%) are the first deductions from gross sales. |
| Match the metric to the operating model | Use SDE for owner-operated units and EBITDA for manager-run or multi-unit investments. |
| Build your own expense model | Only 32% of franchisors provide full P&L data in Item 19; independent modeling fills the gap. |
| Break-even analysis anchors risk assessment | Calculating break-even revenue shows the minimum sales threshold required for the unit to survive. |
Why most franchise buyers miscalculate profitability before they sign
The most persistent error I see in franchise financial analysis is treating Item 19 gross sales as a proxy for profit. Buyers read "$1.5 million in average unit volume" and mentally divide by some rough margin estimate without ever building a real expense model. The result is a profitability projection that looks reasonable on a napkin and falls apart in year one.
The second error is ignoring owner compensation treatment. A franchisor presenting "net income of $180,000" may have excluded the owner's $90,000 salary from expenses, making the business appear twice as profitable as it actually is for a buyer who plans to draw a salary. Always ask explicitly: is owner compensation included or excluded from the figures presented?
The third error is using average revenue instead of median. In any franchise system with a wide distribution of unit performance, the average is pulled upward by the top 10% of operators. The median tells you what a typical franchisee actually earns. I have seen franchise systems where the median unit earns 40% less than the average unit, which completely changes the investment thesis.
My recommendation: interview at least 10 current franchisees using the contact list in Item 20 of the FDD, build your own three-scenario expense model, and align your profitability metric to how you actually plan to operate the business. The math is not complicated. The discipline to do it rigorously before signing is what separates profitable franchise owners from disappointed ones.
— Cody
How Franchisefasttrack connects you to verified franchise financial data
Calculating franchise profitability requires real data, not marketing materials. Franchisefasttrack gives franchisors and serious buyers direct access to verified franchise financial profiles and a directory of 200,000+ franchisee operators whose real-world results validate or challenge the numbers in any FDD.

Franchisefasttrack's proprietary system connects franchisors with high-income professionals earning $150,000 to $500,000 annually, the buyers who actually do the financial modeling before committing. For franchisors, this means fewer unqualified conversations and a reported lead-to-close rate of 34%. For buyers and investors, it means access to a platform built around financial transparency rather than sales volume. If you are serious about evaluating franchise opportunities with the rigor this article describes, Franchisefasttrack is where that process starts.
FAQ
What is the basic formula for franchise profitability?
Franchise profitability equals gross revenue minus all expenses, including royalties, advertising fees, COGS, labor, rent, and overhead. The result is net profit, which is then divided by gross revenue to calculate net profit margin.
What does FDD Item 19 tell you about franchise earnings?
FDD Item 19 is the only legally required source for financial performance representations, but only 32% of franchisors include full profit and loss statements. Most disclose gross sales only, requiring buyers to model expenses independently.
What is the difference between SDE and EBITDA in franchise valuation?
SDE adds owner compensation back to net profit and is used for owner-operated franchise units. EBITDA excludes owner salary and is preferred by multi-unit investors who plan to hire management, making it the standard metric for larger portfolio underwriting.
How do you calculate the break-even point for a franchise?
Break-even revenue equals fixed costs divided by one minus the variable cost percentage. This formula identifies the minimum sales volume required to cover all costs before the franchise generates any profit.
How reliable is Item 19 data for building a profitability model?
Item 19 data is a legally substantiated starting point, but it is often incomplete. Buyers should combine Item 19 gross sales figures with industry expense benchmarks and direct franchisee interviews to build a credible profitability model before making any investment decision.
Recommended
- Blog - Franchise Fast Track | Franchise Development Insights
- Franchise Growth Strategies for Sustainable Scale in 2026 | Franchise Fast Track Blog
- Franchise Startup Costs: A Franchisor's Benchmarking Guide | Franchise Fast Track Blog
- A High-Performance Franchise Marketing Strategy for 2026 | Franchise Fast Track Blog
Ready to see results like these for your franchise?
Stop wasting money on leads that never close. Start getting hundreds of replies from high-net-worth professionals daily.