Franchise Market Research That Wins Territories
851,402 franchise establishments and $936.4 billion in projected U.S. franchise output make one point unavoidable: franchise market research has to separate sellable territories from survivable ones. A brand with 50 or more locations can't treat franchising as one market, because the core decision is whether a specific QSR, home services, fitness and wellness, or senior care concept can open, staff, finance, and retain units in a specific geography.
That is why the strongest analysis ties industry demand, FDD evidence, and local operator capacity together. A useful framing is close to the discipline of market intelligence explained, where the work is not just collecting facts but translating them into a better territory thesis.
Table of Contents
- Why Franchise Market Research Starts With 851402 Units
- Size Categories With Census Unit Density and Sales
- Read Competitors Through FDD Items 7 19 20 and 21
- Map Territories That Units Can Actually Support
- Segment Buyers by Capital Risk and Survivability
- Turn Research Into Pipeline and Territory Growth
Why Franchise Market Research Starts With 851402 Units
The U.S. franchise sector is large enough to justify category-by-category analysis, not generic aggregation. The 2025 Economic Outlook projects 851,402 franchise establishments, 2.5% year-over-year growth, and more than 20,000 additional units. It also projects $936.4 billion in output, up 4.4% from $896.9 billion in 2024, with franchise GDP reaching $578 billion and employment exceeding 9 million jobs in the projection year IFA outlook.
That scale matters because 50-plus-unit brands compete inside a market made up of many different verticals, not one uniform franchise ecosystem. QSR, home services, real estate brokerages, fitness and wellness, automotive services, health and beauty, retail, education, and senior care each have different investment thresholds, staffing models, territory shapes, and candidate profiles.
The right question is not how big franchising is
The better question is which category can still absorb units without breaking the operating model. A QSR system with dense trade areas, wage pressure, and heavy staffing behaves nothing like a senior care brand with relationship-led local demand or a home services model with lower fixed-site intensity.
Practical rule: a territory that looks attractive on unit count alone can still be unworkable if Item 20 turnover, Item 7 capital needs, and local labor supply don't align.
That is the core reason franchise market research needs a three-part test, industry demand, unit economics, and operator capacity. Brands that skip one of those three usually overestimate viable expansion.
Size Categories With Census Unit Density and Sales
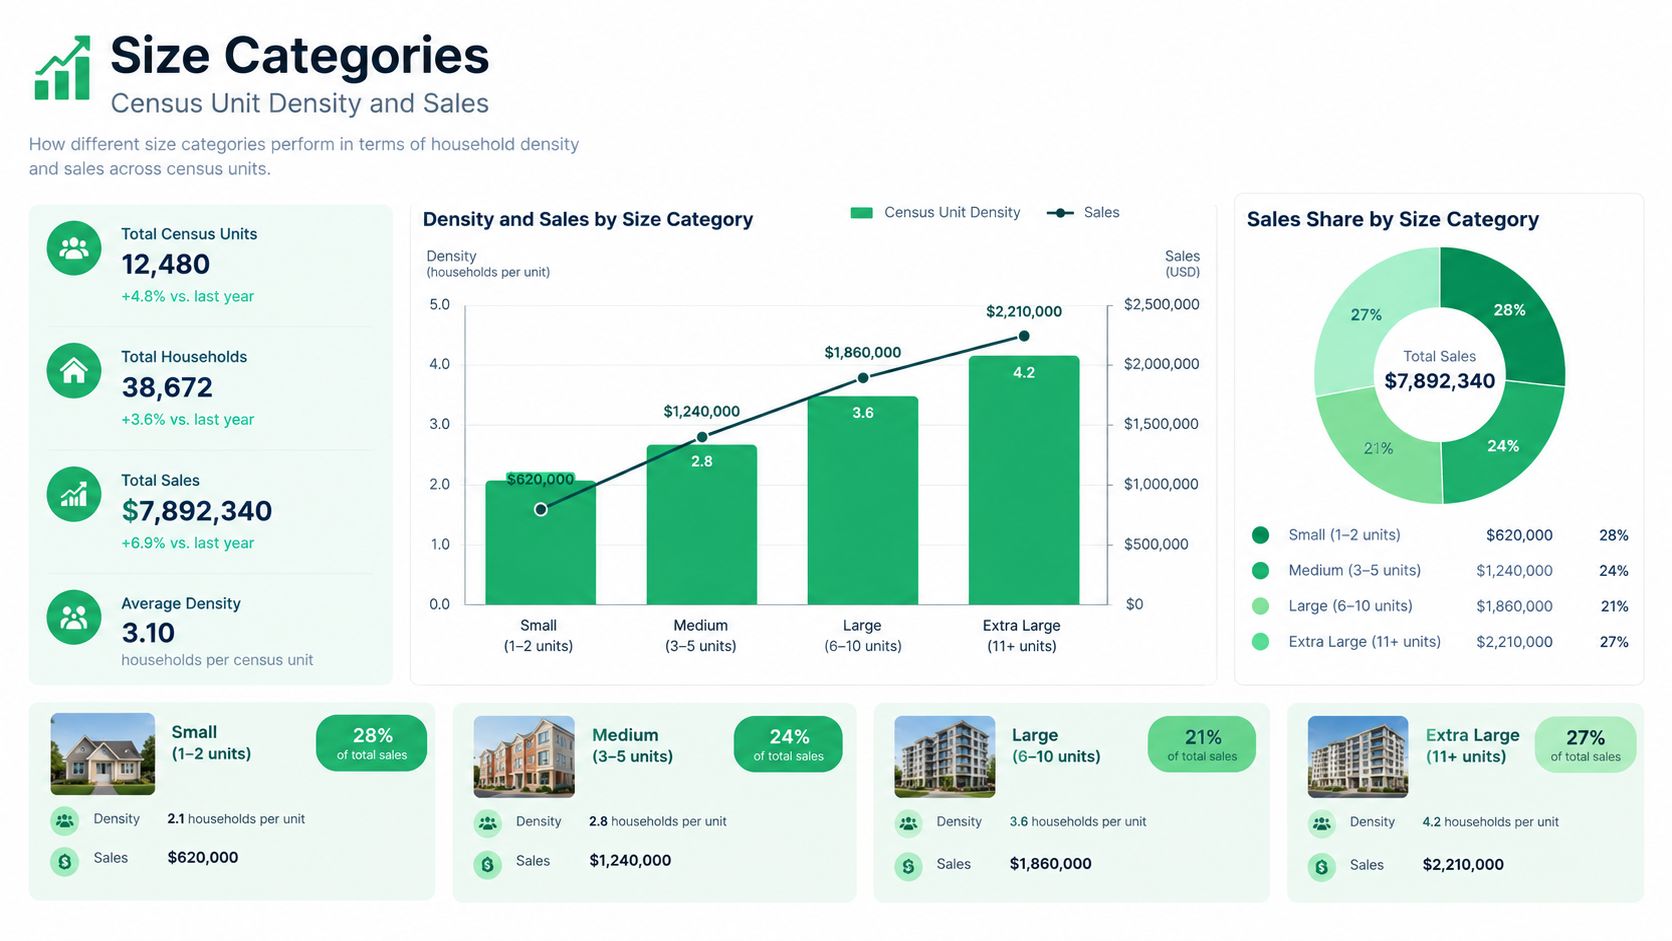
The Census Bureau's franchise data shows why category sizing has to be measured through unit density, employment, sales, and geography. In limited-service restaurants, 122,042 franchise restaurants represented about 54% of all U.S. fast-food restaurants, generated about 70% of sector sales, or $185.4 billion, and accounted for roughly 73% of employment, or 3.6 million workers Census franchise story. This restaurant fact pattern is a warning: franchise penetration can be majority-owned in one category and structurally different in another.
Use category penetration as a maturity signal
The same Census summary reported that franchise establishments across nearly 300 industries employed 9.6 million of the 63.3 million workers in those industries. The labor footprint is broad, but it is uneven across sectors, which is why QSR, home services, personal services, lodging, automotive, and business services need separate sizing models.
A mature category usually shows three patterns. It has a high franchise share of locations, a deep employment base, and dense competition that tightens new territory math.
Underpenetrated categories can look smaller on headline scale while still offering more white-space potential. Home services, senior care, automotive services, and education should be sized against local household formation, fleet density, aging demographics, commute patterns, and service frequency, not just the number of existing chains.
For teams building pipeline around those categories, B2B prospect data sourcing tips help frame how to assemble local business lists before territory calls begin. The research task is the same: identify where the market is dense enough to justify outreach.
For territory planning, data-driven territory market sizing provides the next filter, because unit density only matters when it is matched against trade-area capacity.
Read Competitors Through FDD Items 7 19 20 and 21
The Franchise Disclosure Document is the standardized record set that lets franchisors compare systems on the same terms. The FTC framework created a disclosure document with 23 information items, and franchisors generally must provide it at least 14 calendar days before a prospect pays money or signs a binding agreement FTC rule summary. For competitor analysis structures outside franchising, real estate competitor frameworks can be a useful analogue.
What each item tells a development team
| FDD Item | Research Use | Signal to Record |
|---|---|---|
| Item 7 | Capital threshold and startup burden | Estimated initial investment range |
| Item 19 | Performance claim review | Sales, income, or profit claims with substantiation |
| Item 20 | Growth and attrition analysis | Openings, closures, transfers, terminations, nonrenewals |
| Item 21 | Corporate health check | Audited financial statements |
| Item 20 plus franchisee contacts | Operating reality check | Current and former franchisee validation |
Why the workflow has to be longitudinal
A defensible review starts by extracting three years of outlet counts from Item 20, then calculating openings, closures, transfers, terminations, and net unit growth. Item 19 should then be checked against that turnover picture, because a disclosed average means very little if it hides a narrow universe, exclusions, or a sample that does not reflect the field.
Research discipline: never let system growth stand in for franchisee economics. A brand can add units while operators churn, transfer, or fail to renew.
Item 7 sets the capital threshold and helps segment candidates by budget. Item 19 shows whether a franchisor has made a substantiated performance claim at all. Item 21 helps separate a growing system from a financially fragile one by putting audited financial statements into the same review file.
The goal is to recognize that standardized disclosures are strongest when they are treated as comparable records across brands. The FDD practitioner's guide fits naturally into that workflow, because analysts can compare QSR, fitness and wellness, health and beauty, retail, and real estate brokerage systems on the same evidence base, not on sales deck language.
Map Territories That Units Can Actually Support
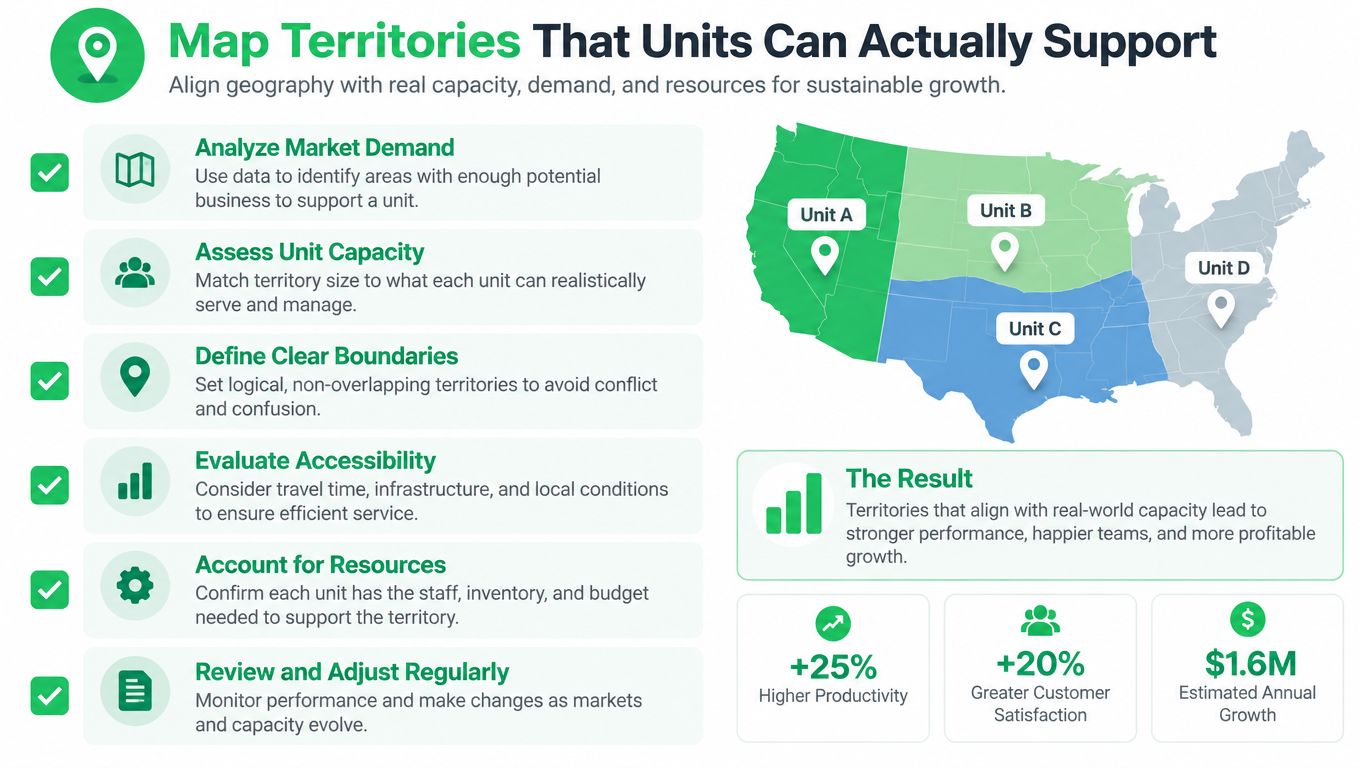
Territory sizing changes once Item 20 turnover is treated as a capacity indicator instead of a rearview-mirror disclosure. The same outlet table that shows growth can also reveal whether a system relies on replacements, transfers, or thinly supported openings, which is why the five-part workflow has to reconcile Item 20 with Item 19 and local operating realities.
Growth alone can be misleading
A brand can post net unit growth while still producing a fragile operating pattern. That's why geography, ownership type, and outlet changes have to be segmented together, franchise-owned units don't behave exactly like company-owned units, and mature territories don't look like first-wave expansion markets.
The 2025 franchisor survey reinforces the point. In a survey of 171 senior executives representing 229 brands and more than 96,000 units, 37% named labor availability, quality, or cost as their top challenge, 70% reported unfilled vacancies, and 56% said labor constraints were limiting growth IFA survey. That makes labor a market-sizing input, not a back-office issue.
Supportable units depend on staffing, not just demand
A territory that can support consumer demand may still fail if manager recruitment is weak or wage pressure is too high. This is especially relevant in QSR, fitness, senior care, home services, and health and beauty, where the local labor pool can be a tighter constraint than customer demand.
Territory development strategy for franchisors works best when the territory model tests employee-per-unit requirements, labor intensity, and replacement risk before a market is awarded. That approach avoids assigning too many sellable territories to places that can't support stable operations.
A territory is only real if it can be staffed, not just sold.
Franchise Fast Track's automation guide is relevant here because the same territory logic should drive lead routing, not just expansion planning. If the local market can't support the unit, it shouldn't fill the pipeline with unqualified conversations.
Segment Buyers by Capital Risk and Survivability
Item 7 sets the cash requirement, but survivability depends on how much debt a buyer can carry after opening. SBA-backed lending data shows that liquidity alone does not erase risk, especially for smaller loans and undercapitalized operators. FTC issue spotlight
Use debt data to sharpen the buyer profile
FTC staff reviewed 66,291 SBA-backed franchise loans issued from January 1, 2013, through September 30, 2023, and found that franchise borrowers had a slightly higher default rate than non-franchise borrowers. The reported average franchise default rate was 3.9%, although most franchises had rates of 1% or less and some outliers were materially higher. The same FTC staff analysis is the reason smaller-balance SBA lending deserves close scrutiny.
It found that smaller franchise loans carried higher default risk, with each doubling of loan size associated with an approximately 0.8-to-1.4-percentage-point reduction in defaults. Lower minimums widen the buyer pool, but they also expose weaker balance sheets sooner. That is why small-balance SBA lending can look attractive on the surface while still masking capital fragility underneath.
Prioritize by liquidity, not by curiosity
| Buyer profile | Capital risk | Survivability signal |
|---|---|---|
| Well-capitalized multi-unit operator | Lower | Can absorb ramp losses and support a longer payback curve |
| First-time owner with thin liquidity | Higher | More exposed to delayed break-even and labor shocks |
| Territory redeveloper or replacement buyer | Moderate | Needs clean transfer economics and validated local demand |
| Expansion buyer in a dense metro | Variable | Depends on wage pressure, rent, and staffing availability |
That matrix matters because survivability is a separate filter from expressed interest. A buyer may fit the brand story and still fail the cash-flow test once working capital, payroll, and slower sales are added to the model.
capital verification in franchising belongs before discovery calls are booked, especially in automotive, education, senior care, and home services where opening economics can stretch beyond the obvious startup budget. The key question is whether the buyer can survive the ramp, not just whether the buyer can sign.
Turn Research Into Pipeline and Territory Growth
Lead source data only matters if it improves qualified conversation volume. A 2026 survey reported that 49% of respondents got franchise leads from digital advertising, 38% from brokers, 31% from franchise opportunity websites, 34% from franchise portals, 34% from pay-per-click search, and 31% from social-media advertising lead source survey. Those percentages overlap, which is exactly why source-level volume can't be confused with source-level quality.
Measure channels against capital and territory fit
If Item 7 sets the investment floor and Item 20 identifies where the system is growing or churning, then channel performance should be judged on qualified discovery calls, validation completion, and signed units. A portal can generate volume without producing the right capital profile, and a broker can produce names without producing fit.
Outbound to verified candidates becomes the stronger option when a brand is handling 20 or more qualified discovery calls per month, because the team can afford to score liquidity, multi-unit potential, geography, and operating background before the first sales conversation. That is where a data infrastructure like Franchise Fast Track fits naturally, with a registry of 7,000+ franchise brands, 68,000+ FDDs, 31,000+ multi-unit franchisees, and 3.5 million classified contacts as its operating base.
What a development leader should do next
- Compare channel yield by quality, not lead count: broker, portal, paid search, and outbound should all be measured against actual discovery outcomes.
- Filter by Item 7 affordability: if the candidate can't clear the documented investment range, the lead isn't a real opportunity.
- Use Item 20 to guide territory outreach: multi-unit expansion logic is different from replacement-buyer logic.
- Match labor-sensitive markets with verified operators: the best territory in theory can still be a weak territory in practice.
The strongest franchise market research doesn't stop at market size. It turns Census data, FDD disclosure, SBA default patterns, and labor capacity into a clearer decision on where to recruit, where to slow down, and where to hold territory for better operators.
Franchise Fast Track organizes this kind of evidence into searchable FDDs, franchisee records, and development data that help franchisors compare territories, buyer profiles, and system growth more cleanly. For brands that need a practical way to connect market research to pipeline and territory decisions, visit Franchise Fast Track and review the platform through the lens of your own expansion model.
Ready to see results like these for your franchise?
Stop wasting money on leads that never close. Start getting hundreds of replies from high-net-worth professionals daily.