Multi Unit Leadership
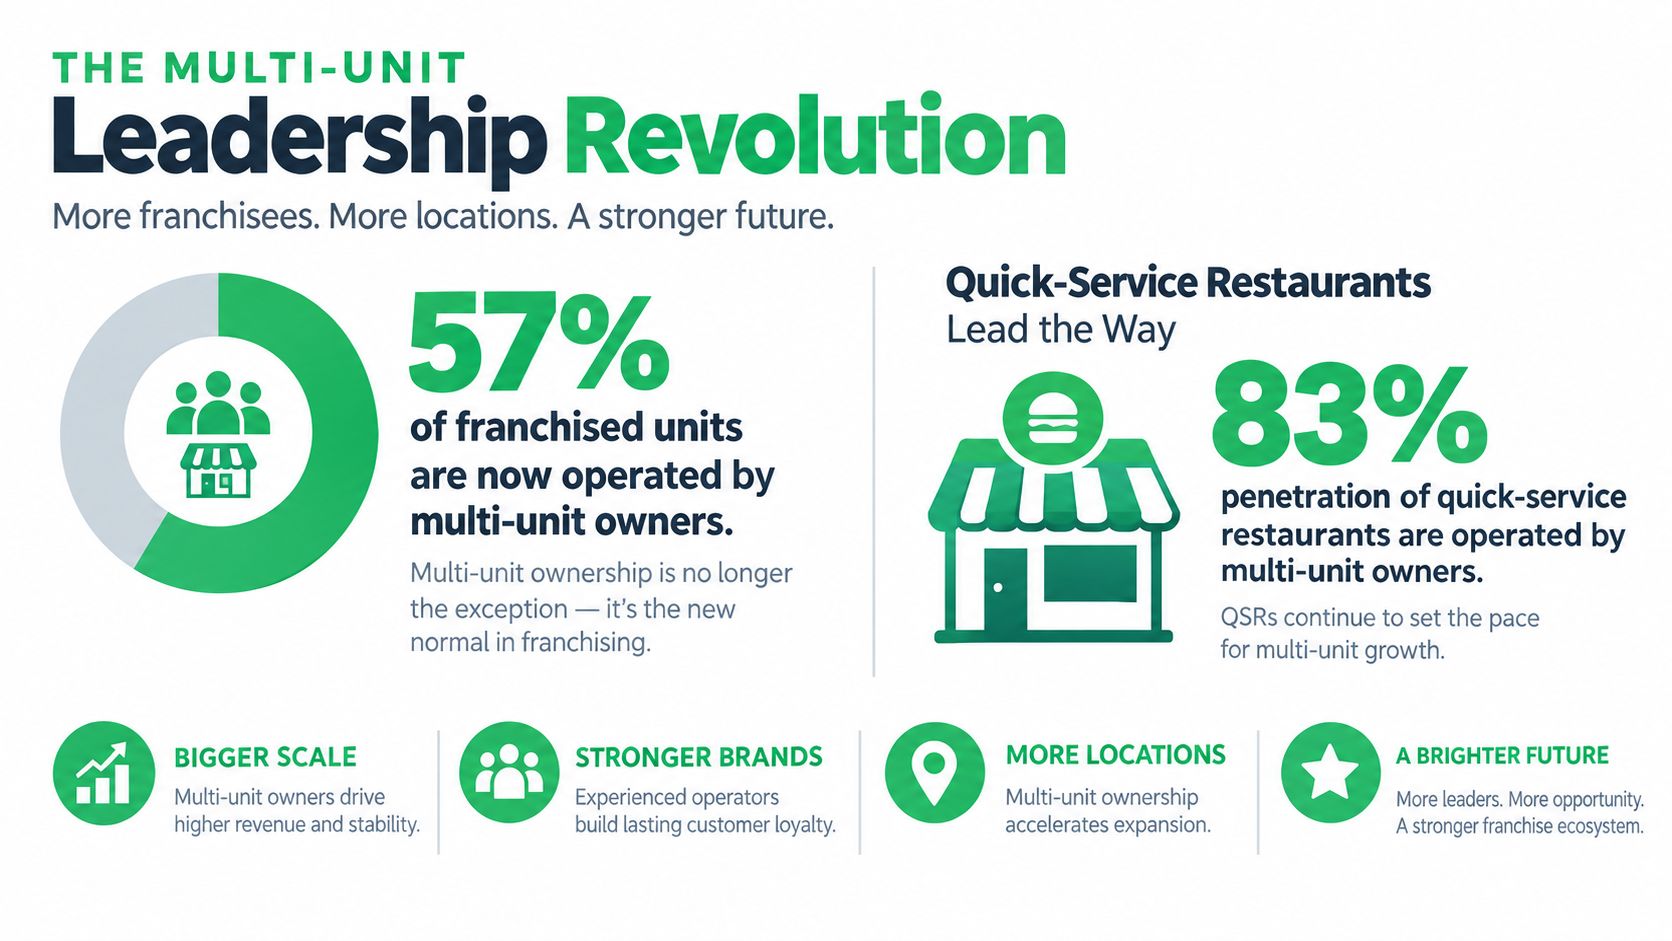
57% of franchised units are operated by multi-unit owners, and QSR penetration reaches 83%. Multi-unit leadership is no longer a specialized growth tactic for exceptional operators. For United States franchisors with 50 or more locations, it's a core channel for territory development, operating consistency, and durable system growth.
The strategic question has changed. Instead of asking whether a single-unit franchisee can run one strong location, development executives must determine whether an operator can build the management infrastructure, decision rights, talent pipeline, and financial controls required to sustain a portfolio. Capital matters, but capital without delegation capability creates a larger failure surface.
Table of Contents
- The Multi-Unit Leadership Revolution in Franchising
- Building Your Multi-Unit Operating Architecture
- Designing Supervisory Spans That Scale
- Using Leading Indicators to Validate Readiness
- Setting Performance Ceilings for Portfolio Growth
- Bridging Owner Control with Scalable Systems
- Next Steps for Multi-Unit Growth Strategy
The Multi-Unit Leadership Revolution in Franchising
57% of franchised units are operated by multi-unit owners, and in QSR that figure reaches 83%. The 2026 FRANdata ownership study tracked 433,558 franchised units and showed how far ownership has shifted toward operators who run portfolios, not just individual stores.
For franchise development teams, that changes the job. A brand with 50 or more locations is recruiting people who can do more than run one good unit. It is recruiting operators who can hire and coach general managers, fund build-outs, absorb early unit volatility, and keep execution consistent across several territories. Multi-unit leadership is the operating layer between ownership ambition and repeatable field performance.
This pattern is not new, but the concentration is sharper now. A literature review of multi-unit franchising found that Kaufmann and Dant reported 88% of surveyed franchisors had multi-unit franchisees in 1996. The same review noted that existing franchisees opened 83% of new Mexican restaurants in 1994, and existing McDonald's franchisees opened 61.5% of all new restaurants between 1980 and 1990. Franchising has favored experienced operators for a long time. What has changed is how much future growth is concentrating in larger platforms.
Where portfolio growth is concentrating
The biggest signal is not that small multi-unit groups are growing. It is that larger ones are growing faster. FRANdata's multi-unit ownership trends report compared 2010 and 2025 operator counts and found that owners of two to five units increased from 28,862 to 34,218, while operators with 50 or more units rose from 162 to 504. Growth also accelerated across the middle tiers, from six to ten units through 26 to 50 units. That matters because the ownership groups taking more territory are usually the ones already building management layers, reporting cadence, and local leadership benches.
| Portfolio segment | 2010 operators | 2025 operators | Change |
|---|---|---|---|
| Two to five units | 28,862 | 34,218 | 18.56% |
| Six to ten units | 3,411 | 4,199 | 23.10% |
| 11 to 25 units | 1,630 | 2,175 | 33.44% |
| 26 to 50 units | 397 | 615 | 54.91% |
| 50 or more units | 162 | 504 | 211.11% |
For a chief development officer, the trade-off is practical. A proven operator with a functioning management bench can reduce repeated recruiting, onboarding, site approval, and field-support demands compared with a pipeline built entirely on first-time single-unit owners. The difference between a candidate who wants one location and an operator capable of leading a regional platform should shape territory allocation, qualification, incentives, and support design.
Building Your Multi-Unit Operating Architecture
Multi-unit leadership fails when a franchisor treats expansion as a sales event rather than an operating architecture. The operator needs clear ownership of finance, operations, marketing, facilities and safety, and human resources, the five core dimensions identified in the chain restaurant management literature/16.Chapter%2015%20-%20Chain%20restaurant%20management.pdf).

Five dimensions, four decision levels
Finance should sit close enough to the portfolio to expose unit-level variance, but headquarters must define reporting standards, approval limits, and cash controls. The owner or platform president sets capital priorities. Regional leaders interpret performance. General managers own controllable expenses. Headquarters audits the system.
Operations requires a documented playbook for opening routines, service standards, audits, safety, and escalation. A regional leader should coach general managers rather than become the substitute general manager for every location. The franchisor's operating team should define essential brand requirements while leaving room for local execution where the concept permits it.
Marketing benefits from shared planning, creative standards, and measurement. Local managers need authority to act on market conditions, but campaigns, promotions, and reputation responses should connect to brand-level rules. A QSR may centralize media and menu messaging more tightly than a home services brand that depends on local demand generation and technician availability.
Facilities and safety need explicit ownership because deferred maintenance and compliance exceptions often remain invisible until they affect customer experience or unit economics. Regional leaders should track recurring issues, while headquarters establishes inspection protocols and capital standards.
Human resources determines whether the portfolio can grow without making the owner the bottleneck. Recruiting, onboarding, manager development, succession planning, and internal promotion need shared processes. The operator should know which locations have a ready general manager, which require external hiring, and where a regional role would create capacity.
A useful reference for formalizing these relationships is what is organizational design, particularly when a founder-led structure must evolve into defined roles and decision rights. The practical test isn't whether the organization chart looks polished. It's whether managers know who can approve labor changes, capital spending, hiring exceptions, local marketing, and operational deviations.
| Decision area | Owner or platform leader | Regional leader | General manager | Headquarters |
|---|---|---|---|---|
| Capital allocation | Approves priorities | Recommends needs | Reports conditions | Sets controls |
| Daily operations | Reviews trends | Coaches execution | Owns results | Defines standards |
| Hiring leaders | Approves senior roles | Assesses readiness | Recruits unit staff | Provides systems |
| Local marketing | Sets portfolio direction | Coordinates markets | Executes locally | Protects brand |
| Compliance | Reviews exceptions | Corrects patterns | Maintains standards | Audits framework |
The measurement layer should include manager span of control, internal promotion rates, labor cost variance, customer-experience scores, compliance exceptions, and store-level EBITDA. Those metrics reveal whether delegation is increasing capacity or merely moving problems into less visible parts of the portfolio. Franchisors building a durable support model can also review building a scalable franchise framework for a broader support-system perspective.
Designing Supervisory Spans That Scale
A multi-unit manager commonly oversees approximately five to 15 restaurants, according to the hospitality operations reference/16.Chapter%2015%20-%20Chain%20restaurant%20management.pdf). That range is a starting point, not a staffing formula. Unit maturity, travel time, manager capability, operating complexity, and the reliability of reporting systems determine whether a span is workable.
Research on restaurant executives cited in the same source found that earlier expansion of span of control later shifted back toward tighter spans. The lesson is practical: a system can overestimate the efficiency of a broad regional structure, then discover that coaching quality, visits, and issue resolution deteriorate as coverage expands.
Supervisory Span Models by Unit Maturity
| Maturity Level | Units per Manager | Recommended Model | Key Risk |
|---|---|---|---|
| New or unstable units | 5 or fewer | High-touch regional coaching with frequent site reviews | Owner or regional leader becomes the operational substitute |
| Mixed portfolio | 5 to 10 | Standardized reporting with differentiated coaching | Stable units receive too much attention while weak units remain hidden |
| Mature, consistent portfolio | 10 to 15 | More centralized performance review with local execution | Travel distance and thin coaching reduce oversight |
| Complex or geographically dispersed portfolio | Fewer than the upper range | Additional area leadership or market-based supervision | Shared services expand before accountability is clear |
Centralized supervision works when units share systems, labor models, opening routines, and customer expectations. It also suits portfolios with strong general managers who can solve routine problems without escalation. Decentralized supervision makes more sense when markets differ materially, local hiring conditions vary, or service delivery depends on community relationships.
Practical rule: A manager's span should be sized to the number of locations that can receive meaningful coaching, not the number that can fit on a dashboard.
The franchisor should examine missed visits, recurring audit exceptions, manager turnover, unresolved maintenance issues, and the time between a problem appearing and a corrective action. If those indicators worsen as coverage expands, the answer isn't always more technology. It may be a narrower span, an area manager, or a different market boundary.
This is also why development staffing belongs in the operating plan. Franchise Fast Track's perspective on team expansion is relevant because the same discipline used to build development throughput applies to regional leadership: defined roles, measurable capacity, and clear ownership of the next action.
Using Leading Indicators to Validate Readiness
A strong single-unit operator isn't automatically ready to lead a second unit. Empirical work cited in the multi-unit management literature/16.Chapter%2015%20-%20Chain%20restaurant%20management.pdf) found that respondents often felt competent in their current positions but uncomfortable moving to the next supervisory level. Promotion decisions based only on technical execution therefore create predictable risk.
A formal readiness gate should require documented bench strength, a trained area manager, repeatable onboarding, and stable unit-level economics. The operator should demonstrate that the current location can perform without constant owner intervention before another territory is approved.
The readiness scorecard
The scorecard should combine operating evidence with leadership evidence. The following indicators are useful because they expose different failure modes:
- Manager turnover: Repeated departures may signal weak coaching, unrealistic labor plans, or an owner who retains too many decisions.
- Audit variance: Inconsistent audit results show whether the brand standard survives outside the owner's direct presence.
- Labor productivity: Unexplained variance can indicate poor scheduling, weak forecasting, or inadequate manager training.
- Customer complaints: Complaint patterns reveal service inconsistency before financial reports show the full effect.
- Same-unit sales: Stable performance across existing units provides a better readiness signal than total portfolio revenue.
- Cash controls: Exceptions, delayed reconciliations, or unexplained variances should stop expansion until the control environment improves.
The scorecard shouldn't be a single opaque rating. Each indicator needs an owner, a review period, a documented threshold, and a corrective action. A candidate may have strong same-unit sales but weak bench strength. Another may have capable managers but inconsistent cash controls. Both require different interventions.
Separate candidate quality from expansion readiness
Franchise development teams should evaluate multi-unit appetite during qualification, but appetite isn't proof of capacity. The review should connect financial statements, leadership history, staffing plans, geographic intent, and the operator's ability to delegate. The franchisor can also evaluate franchisee lead scoring with readiness attributes that distinguish a capitalized prospect from a scalable operator.
A readiness gate works best when it has a defined decision: approve, approve with conditions, defer, or decline. Conditions might include hiring an area manager, completing manager onboarding, correcting audit variance, or proving stable economics across the current portfolio. That process protects the brand from rewarding ambition before the infrastructure exists to support it.
Setting Performance Ceilings for Portfolio Growth
More units don't automatically produce better returns. A multi-country franchise study found that owning more than three units was associated with a significant decline in sales and profit per unit. The finding challenges a common development assumption: that shared overhead, purchasing power, and brand familiarity will keep improving unit economics as portfolio size increases.
The correct management question is not, “How many locations can this operator control?” It's, “At what portfolio size does the next location still produce acceptable normalized performance without weakening existing units?”
Find the inflection point
A franchisor should define a target portfolio size, then measure performance after each additional location. The relevant measures are per-unit sales, per-unit profit, labor efficiency, service quality, and compliance performance. Total revenue can rise while per-unit economics deteriorate, particularly when the owner adds locations faster than the leadership bench develops.
Medium-sized operators face a specific organizational problem. Research cited in the same study describes operators becoming “stuck in the middle” when their human-resource systems are neither customized enough for a small portfolio nor standardized enough for a large one. A two-unit owner may still rely on direct oversight, while a larger platform needs formal recruiting, training, analytics, and area leadership. The transitional structure often creates duplicated work without delivering reliable control.
Scale should be approved when the next unit strengthens the management system, not when the territory map simply has room for another pin.
The franchisor can use a portfolio review after every opening. The review should compare the new unit with the operator's existing units, assess whether manager workload has changed, and identify any decline in service or labor performance. If marginal economics weaken, further territory awards should pause while the operator invests in training, area management, shared services, or analytics.
Preserve the right ownership mix
A purely multi-unit network isn't always superior. The research found threshold effects suggesting that a mixed ownership structure may outperform a purely multi-unit network in some conditions. Single-unit owners can provide local attention, community knowledge, and direct accountability in markets where geographic complexity makes centralized portfolio management less effective.
The right mix varies by vertical. QSR systems may support high multi-unit penetration because operating routines are repeatable and unit economics can be compared closely. Senior care, education, health and beauty, and home services may require more local leadership because staffing, customer relationships, and service delivery differ by market. A franchise system should use normalized per-unit profitability and leadership depth rather than total revenue as the qualification standard.
Bridging Owner Control with Scalable Systems
Large portfolios create a governance problem, not just a staffing problem. The 2025 Multi-Brand 50 reported that Flynn Group grew from 2,520 to 2,745 units, while Sun Holdings expanded from 1,193 to 1,704 units. At that scale, the owner cannot remain the default approver for every staffing decision, marketing adjustment, maintenance issue, or operating exception.
The architecture should assign decision rights before growth exposes the gaps. Owners or platform executives set portfolio strategy and capital priorities. Regional leaders own market execution and manager coaching. General managers control daily unit performance within defined limits. Headquarters sets brand standards, reporting requirements, technology governance, and compliance expectations.
Add structure when the metrics demand it
An area manager belongs in the structure when general managers need consistent coaching that a regional leader can't provide without losing coverage. Shared services make sense when recruiting, payroll support, financial reporting, procurement, or marketing administration is being duplicated across units. A formal operating council becomes useful when decisions require coordination across finance, operations, people, technology, and development.
These additions shouldn't be triggered by unit count alone. The decision should follow evidence such as rising manager span, declining internal promotion rates, increasing labor cost variance, recurring compliance exceptions, weaker customer-experience scores, or deteriorating store-level EBITDA. Each new layer must have a defined mandate and measurable effect.
| Governance layer | Owns | Measures |
|---|---|---|
| Owner or platform executive | Strategy, capital, territory priorities | Portfolio economics and growth quality |
| Regional leader | Coaching, market execution, escalation | Manager performance and compliance trends |
| General manager | Staffing, scheduling, service, daily results | Unit-level economics and customer experience |
| Headquarters | Standards, systems, controls, shared support | Consistency, reporting quality, and exception rates |
Centralization improves consistency but can slow local responses. Autonomy improves speed but can create hidden brand and compliance risk. The answer is not maximum control or maximum freedom. It's a documented boundary system that tells each role what it can decide, what it must report, and what requires approval.
Local execution also depends on accurate market information. A team evaluating location performance, reputation, and local demand may find a local SEO tool useful as part of a broader reporting stack, provided local visibility data is connected to unit economics rather than treated as a standalone marketing score.
Delegation succeeds only when the numbers improve without brand drift. The leadership team should compare manager productivity, labor variance, customer-experience scores, compliance exceptions, and store-level EBITDA before and after decision rights move downward. If local speed improves but standards weaken, the governance boundary needs adjustment.
Next Steps for Multi-Unit Growth Strategy
Multi-unit leadership should become a formal operating discipline for brands with 50 or more locations. The implementation sequence is straightforward:
- Segment the pipeline: Identify operators with proven multi-unit experience, realistic market plans, and demonstrated leadership depth.
- Define the architecture: Assign decision rights across owners, regional leaders, general managers, and headquarters across finance, operations, marketing, facilities, and human resources.
- Set supervisory limits: Match manager coverage to unit maturity, geography, reporting quality, and coaching capacity.
- Install the readiness gate: Require bench strength, trained area leadership, repeatable onboarding, stable economics, and reliable controls before approving additional territories.
- Track the ceiling: Measure normalized per-unit sales, profit, labor efficiency, service quality, and compliance after every opening.
- Validate the development story: Review FDD Item 7 for initial investment, Item 19 for financial performance representations, Item 20 for outlets and franchisee turnover, and Item 21 for audited financial statements. The FTC franchise disclosure guidance states that financial-performance representations belong in Item 19 and that outlet and franchisee information appears in Item 20.
The 2025 U.S. franchise outlook projected 851,000 establishments, $936.4 billion in total economic output, more than 9 million jobs, 2.5% unit growth, and 4.4% output growth. QSR franchises alone were projected to produce approximately $322 billion in economic output and reach 204,366 establishments, according to the International Franchise Association outlook. Those projections reinforce the need for throughput, but growth without leadership architecture compounds operating risk.
Franchise Fast Track's data infrastructure includes a registry of 7,000+ franchise brands, a database of 68,000+ FDDs, a directory of 31,000+ multi-unit franchisees, and classified data covering more than 3.5 million franchise industry contacts. For teams building a measurable franchise development program, those resources can support operator identification, FDD research, and portfolio-focused market analysis.
Franchise Fast Track supports established franchisors with data-driven franchisee recruitment and intelligence across multi-unit operators, FDDs, brands, and industry contacts. Visit Franchise Fast Track to review the platform and connect multi-unit growth strategy with a more qualified development pipeline.
Ready to see results like these for your franchise?
Stop wasting money on leads that never close. Start getting hundreds of replies from high-net-worth professionals daily.