How Franchise Income Supplements Your Salary in 2026
Franchise income supplements your salary through net profits drawn after operating expenses, royalties, and debt service are paid, not through a traditional paycheck. The average U.S. franchise owner earns about $112,777 annually, but median outcomes from a wider 2026 analysis land closer to $52,000, and single-unit food operators often see lower earnings around $42,000. Home-services owners running three units may clear $300,000 or more. The gap comes down to industry margins, how many units you own, and how honestly you model the numbers before you sign.
A few realities worth knowing upfront:
- Franchise owners are typically compensated through owner draws, profit distributions, or a combination of salary and draws in active owner-operator models, not a W-2 paycheck from the franchise entity.
- Multi-unit ownership of 3–5 units can raise annual income to $300,000–$500,000, making it the most reliable path to replacing a professional salary.
- Most franchises require a substantial ramp-up period before generating steady, predictable income, so planning for a ramp period is essential.
- Item 19 of the Franchise Disclosure Document (FDD) is the primary financial disclosure tool, but it usually does not reflect actual owner take-home pay after deducting royalties, debt service, and owner labor costs.
How franchise income supplements salary: the earnings calculation
The math starts at gross sales and works down through several layers before you reach anything resembling personal income. Understanding each layer is what separates a realistic projection from a franchisor's marketing slide.
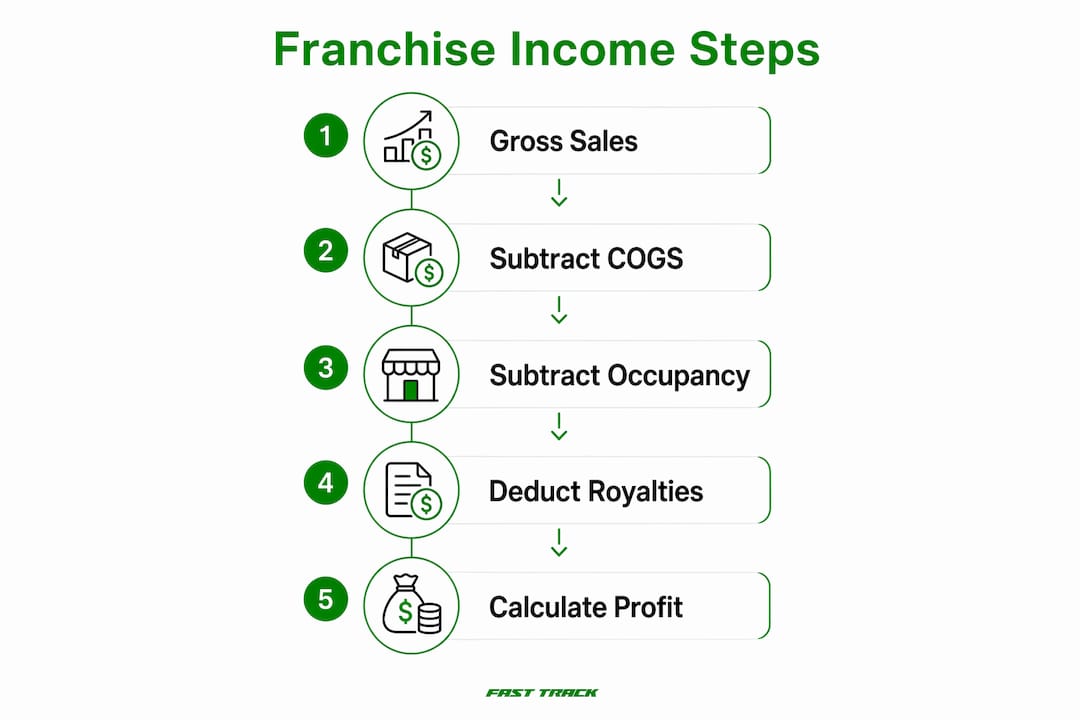
Start with gross sales, then subtract cost of goods sold (COGS). In food franchises, COGS typically runs 25–35% of revenue. In service-based concepts, it drops to 5–20%. Labor is the next major line, often 20–35% of sales in food and fitness, and it tends to be the most volatile because local minimum wage laws and tight labor markets can move it several points in either direction. Occupancy costs, including rent, common area maintenance, and utilities, typically consume 6–12% of sales, with prime retail locations at the painful end of that range.

After occupancy, royalties and ad fund contributions come off gross sales, not profit. That distinction matters. A royalty of 5–8% and an ad fund of 1–4% are owed even in a losing month. Debt service, typically an SBA loan payment, takes another slice before you see a dollar. What remains is your pre-tax take-home.
Net margins by industry cluster into recognizable bands:
| Industry category | Typical net margin | Notes |
|---|---|---|
| Food and beverage | 8% | High COGS and labor compress margins |
| Home and personal services | 15% | Asset-light, lower rent, friendliest math |
| Fitness and wellness | 10–20% | Front-loaded buildout; year 3 looks very different from year 1 |
| Retail and products | Varies, often thin | Inventory and shrink eat into margins |
On a typical food franchise with substantial revenue and moderate net margins, operating profit before debt and owner compensation can be a fraction of total sales. Financing costs further reduce actual returns on capital. That is the number most buyers never see on a discovery call.
How franchise owners actually get paid
Franchise owners rarely receive a traditional W-2 salary from the franchise entity. Instead, compensation flows through three main structures, and which one applies to you depends almost entirely on how involved you are in daily operations.
- Owner draws: The most common method. After expenses are paid, you withdraw money from accumulated business profits. Draws are flexible but irregular, which makes personal budgeting harder in the early months.
- Formal salary on payroll: Active owner-operators sometimes put themselves on payroll for a set amount, creating predictable personal cash flow. The risk is drawing a salary before the business consistently generates enough profit to support it, which strains working capital fast.
- Profit distributions: More common in multi-unit or corporate franchise group structures. Distributions are paid out of net earnings after all operating costs, often quarterly or annually.
Passive owners who hire a general manager and step back from daily operations typically see smaller take-home amounts because management payroll is a real expense. Active owners who work the business themselves effectively absorb a manager's salary into their draw, which inflates the apparent income without changing the underlying return on capital.
Pro Tip: Document your compensation method clearly from day one. Whether you take draws, salary, or distributions affects your tax filing, loan eligibility, and how lenders evaluate your personal income if you want to finance additional units later.

The tax treatment differs meaningfully by structure. Owner draws from a sole proprietorship or single-member LLC flow through Schedule C and are subject to self-employment tax. An S-corporation election lets you split compensation between a reasonable salary and distributions, potentially reducing self-employment tax on the distribution portion. Talk to a CPA before you choose your entity structure, not after your first profitable quarter.
Key factors that determine whether franchise income can replace your salary
Several variables determine whether a franchise supplements your income modestly or replaces it entirely. None of them are fixed at the time you sign the franchise agreement.
- Industry type: Margins vary widely by sector. Home services and commercial cleaning consistently produce stronger owner economics than food, despite lower headline revenue. Cleaning franchises showed a median implied owner earnings of roughly $116,000 in a 2026 analysis of 955 brands, while food and restaurant concepts came in at roughly $42,000.
- Number of units: Single-unit ownership rarely replaces a professional salary on its own. Multi-unit expansion is where the math changes. Three to five units in a high-margin category can push combined owner income into the $300,000–$500,000 range by spreading fixed costs across locations.
- Owner involvement: Hands-on operators control quality, catch problems early, and avoid the management payroll that eats passive owners' margins. The tradeoff is time.
- Local market conditions: Demographics, competition, local wages, and rent all affect profitability in ways no national average captures. A franchise that performs well in suburban Texas may struggle in a high-rent urban market with a $17 minimum wage.
- Time in business: Most units earn less in years one and two while building customer flow and working out operational inefficiencies. Steady, predictable income typically arrives in year two or three.
- Startup costs and ongoing fees: Initial franchise fees, buildout costs, and ongoing royalties can significantly reduce early net returns; it is prudent to budget conservatively including working capital reserves.
The risks and variability in franchise income are real. A tight labor market, a rent increase at renewal, or a slow ramp period can push break-even out by six months or more. Modeling the downside scenario, not just the base case, is what separates prepared owners from surprised ones.
How to read Item 19 of the FDD for realistic income estimates
Item 19 is the section of the Franchise Disclosure Document where franchisors may voluntarily disclose financial performance data. It is the best public tool available for estimating earnings, and it requires careful interpretation.
Franchisors rarely publish a clean owner-pay number. What Item 19 typically shows is gross sales, sometimes sliced by quartile or years in operation, and occasionally a partial cost model or EBITDA-style figure. What it almost never subtracts:
- Your royalty and ad fund at your actual rate
- Your debt service, because the franchisor does not know how you financed
- A market salary for the hours you will work in the business
- Local rent, wage rates, or ramp-period losses
When an Item 19 shows a "discretionary earnings" or "owner cash flow" figure, read it as seller's discretionary earnings (SDE): profit before paying yourself and before the bank. To get to actual take-home, subtract a general manager's market salary for the hours you will work (typically $55,000–$70,000 for a full-time role) and your annual debt service. Skip those two adjustments and you will overstate your income by a wide margin.
Pro Tip: Request Item 19 data sliced by unit age, not just overall averages. New units consistently underperform mature ones, and the top-quartile numbers that appear in marketing materials are not where most new owners land in year one.
- Use the median or below-average Item 19 unit for your base-case projection, not the top quartile.
- Adjust disclosed figures for your local rent using an actual lease quote from your target trade area.
- Apply local wage rates to the labor line, not national averages.
- Subtract royalty and ad fund on gross sales at the brand's stated rates.
- Model a break-even or money-losing first year and confirm you have the capital to survive it.
Owners must carefully analyze Item 19 disclosures, adjusting for local rent, labor, royalties, debt service, and owner labor cost to derive accurate income projections. The discipline most buyers skip is subtracting a manager's salary for their own role, even when they plan to do the work themselves.
Steps to supplement or replace your salary through franchise ownership
Getting from "interested in franchising" to "replacing my salary" requires a structured approach. The sequence matters because each step informs the next.
- Build a realistic financial model first. Run three scenarios: conservative, base, and optimistic. Use actual local lease quotes, local wage data, and the brand's Item 6 royalty rates. The conservative scenario should show whether you can service debt and cover personal expenses if revenue ramps slowly.
- Assess your available capital honestly. Plan to spend $100,000–$300,000 in total startup costs for most concepts, with franchise fees accounting for $20,000–$50,000 of that. Add three to six months of working capital on top. Undercapitalization is one of the most common reasons franchises fail in the first year.
- Decide how much time you can commit. Even semi-absentee models require 10–20 hours weekly for the first three to six months to establish operations. If you plan to keep a full-time job, that time commitment needs to fit your schedule before you sign.
- Choose franchises with transparent Item 19 disclosures. A brand that withholds financial performance data is asking you to invest six figures on faith. Prioritize concepts that disclose revenue and cost data by unit age and quartile.
- Plan for multi-unit ownership if income replacement is the goal. A single unit supplements income for most owners. Replacing a $150,000 professional salary typically requires two to four units in a high-margin category, or one exceptionally strong unit in a low-overhead service concept.
- Develop a local marketing plan before you open. Revenue drives everything else. Local SEO, community partnerships, and referral programs cost less than paid advertising and often produce better early results in a defined territory.
- Prepare for a 12–24 month ramp period. Most units do not hit steady-state performance until the second year. Model a money-losing or break-even first year, confirm your working capital covers it, and resist the urge to draw personal income before the business can support it.
You can explore how to build franchise profitability from the ground up, including territory selection and market analysis, before committing to a specific brand.
What industry experts say about maximizing franchise income
The most consistent finding across franchise financial analysis is that multi-unit expansion is the primary driver of income that genuinely replaces a professional salary. Single-unit ownership in most categories produces a modest income, not a wealth-building engine. The owners who reach $300,000 or more annually typically own three to five units in a high-margin category and use the cash flow from unit one to fund the SBA loan on unit two.
The passive income assumption is the most expensive misconception in franchising. Even semi-absentee ownership demands substantial time during the startup phase, and the owners who treat it as truly hands-off in year one tend to see the worst outcomes. A strong general manager changes the equation, but finding, training, and retaining that person is itself a management job.
Territory selection is as important as brand selection. Local market factors like population density, competition, and local wage rates can swing owner earnings by tens of thousands of dollars annually within the same franchise system. Two owners in the same brand, one in a dense suburban market and one in an oversaturated urban corridor, can have dramatically different outcomes.
Hidden labor costs catch many owners off guard. Working the business yourself effectively pays you a manager's salary, but that portion of your draw is wages for your labor, not return on invested capital. Subtract a market-rate manager salary from net income to see your true return. Skip that adjustment and you will consistently overstate what the investment is actually earning.
Tax advantages from franchise ownership are real but conditional. The 20% QBI deduction and Section 179 depreciation require active material participation under IRS rules. Passive investors who fail the material participation tests cannot use franchise losses to offset W-2 wages, which eliminates the primary tax benefit that makes franchise ownership attractive to high-income professionals. The IRS 500-hour and 100-hour tests determine whether your involvement qualifies, so confirm your planned time commitment with a CPA before structuring the deal.
A 2026 analysis of 955 franchise brands found the median implied owner earnings at approximately $52,000, with the 75th percentile reaching roughly $97,000. Only about 6% of brands in the sample cleared $250,000 in implied owner earnings.
The gap between the median and the top outcomes is not random. It reflects industry category, number of units, owner involvement, and how well the owner modeled the economics before signing. Owners who optimize local marketing and manage costs from day one consistently outperform those who rely on the brand's system alone.
Key Takeaways
Franchise income supplements salary most effectively through multi-unit ownership in high-margin categories, with realistic financial modeling and active owner involvement driving the difference between modest draws and full salary replacement.
| Point | Details |
|---|---|
| Average owner earnings | The U.S. average is $112,777 annually, while the median outcome across a broad analysis of brands is approximately $52,000. |
| Multi-unit income potential | Owning 3–5 units in a high-margin category can raise annual income to $300,000–$500,000. |
| Item 19 interpretation | Always subtract royalties, debt service, and a market manager salary from disclosed figures to estimate real take-home pay. |
| Ramp-up timeline | Most franchises require 12–24 months before generating steady, predictable income for the owner. |
| Tax advantages require participation | Tax advantages like the 20% QBI deduction and Section 179 depreciation are generally available only to owners who meet IRS material participation requirements. |
Ready to connect with the right franchise opportunity?

Franchise Fast Track works with franchisors to connect them with verified high-income professionals, executives, directors, and senior managers who are actively researching franchise ownership as a path to salary enhancement or replacement. If you are a franchisor looking to reach buyers who have already done the financial modeling and are ready to move, the franchise lead generation platform at Franchise Fast Track delivers qualified appointments at a reported lead-to-close rate of 34%. Serious buyers are out there. The question is whether your development team is talking to them.
Recommended
- What Is the Franchise Fee? Definition & 2026 Insights | Franchise Fast Track Blog
- Franchise Expansion Revenue Forecasting: 2026 Guide | Franchise Fast Track Blog
- How Franchise Profitability Is Calculated: 2026 Guide | Franchise Fast Track Blog
- Financing for a Franchise: Franchisor's 2026 Guide | Franchise Fast Track Blog
Ready to see results like these for your franchise?
Stop wasting money on leads that never close. Start getting hundreds of replies from high-net-worth professionals daily.