Franchise Expansion Revenue Forecasting: 2026 Guide
Franchise expansion revenue forecasting is the process of estimating future revenues during franchise growth by combining documented performance data, industry benchmarks, and structured financial modeling. The industry term for this practice is franchise financial modeling, and the two terms work together throughout this guide. Franchisors who skip this step routinely underestimate ramp-up timelines, miss financing targets, and misread unit economics. The franchising sector projects total unit counts rising to approximately 845,000 locations nationwide, which makes accurate growth projections more critical than ever. Forecast variance, the gap between projected and actual revenue, is the single metric that separates disciplined expansion from costly guesswork.
What are the main data sources for franchise expansion revenue forecasting?
The Franchise Disclosure Document (FDD) Item 19 is the primary source for any franchise revenue forecast. Item 19 discloses median revenue, revenue by unit vintage, and performance segmented by geography, giving franchisors a documented baseline rather than a guess. Median revenue is the right figure to use. In one FDD analysis, only 40.8% of units outperformed the system average, which proves that averages overstate typical performance due to survivorship bias. Build your baseline from the median, not the headline number.

When Item 19 is not disclosed, which applies to roughly 40% of franchisors, you need an alternative approach. Industry average unit volume (AUV) benchmarks, franchisee interviews, and local market data fill the gap. AUV figures are available through trade associations and published franchise performance reports. Franchisee interviews add qualitative color that no spreadsheet captures, especially for newer markets.
Segmenting revenue streams is non-negotiable. Royalties, transactional sales, and subscriptions behave differently across economic cycles, and mixing them into a single line item masks the trends you need to manage. A service franchise collecting monthly subscription fees has a fundamentally different revenue curve than a quick-service restaurant (QSR) running daily transactions. Model each stream separately from day one.
- FDD Item 19: Pull median revenue, vintage-year performance, and urban vs. suburban splits.
- Industry AUV benchmarks: Use when Item 19 is absent; apply a conservative discount of 10%–15% to account for local market variance.
- Franchisee interviews: Gather qualitative data on ramp timelines, seasonal patterns, and local competition.
- Segmented revenue streams: Model royalties, sales, and subscriptions independently to avoid masking trends.
- Local market data: Layer in demographic and economic data to adjust national benchmarks for your specific territory.
Pro Tip: When reviewing Item 19, always request the full data set, not just the summary table. The distribution of results across all reporting units tells you far more than the median alone.
How do ramp-up curves and scenario modeling improve revenue projections?
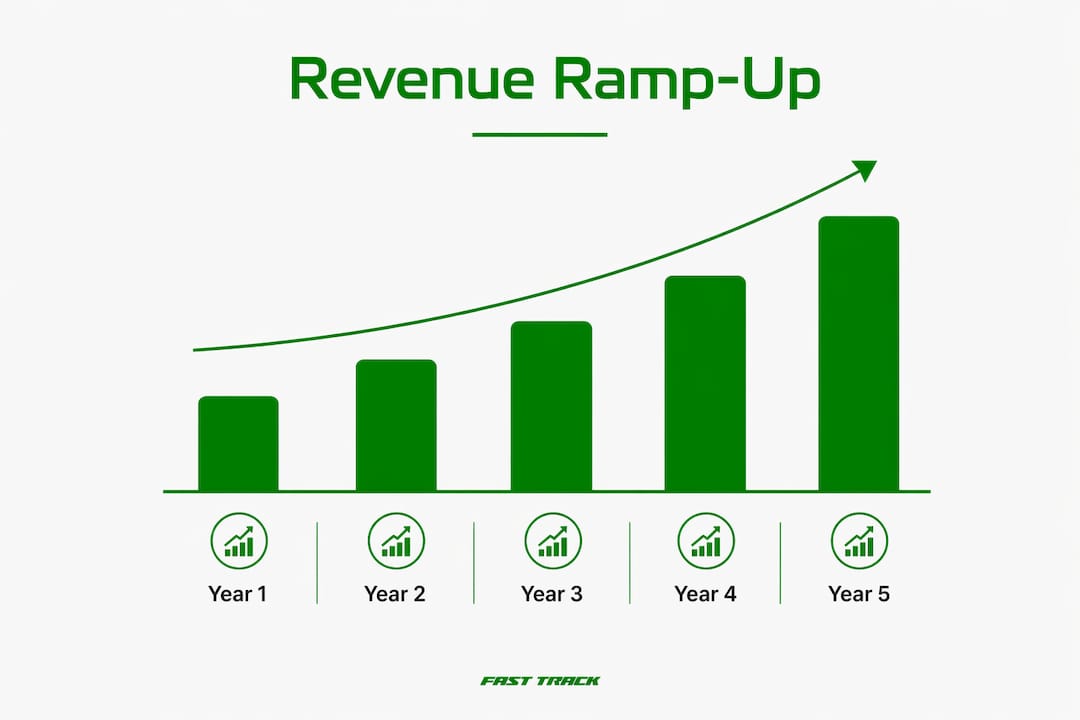
Most franchisors underestimate how long a new unit takes to reach full revenue potential. Revenue ramp-up typically progresses from 65% of mature AUV in Year 1 under a conservative scenario, reaching approximately 100% by Year 3. QSRs ramp faster than service franchises because foot traffic builds quickly, while service brands depend on local reputation and referral networks that take longer to develop. Applying a ramp curve based on vintage data prevents the liquidity crises that hit franchisors who assume immediate maturity.
Three-scenario modeling is the standard framework for franchise financial planning. Each scenario applies a different percentage of mature AUV across a five-year projection:
- Conservative scenario: Year 1 at 65% of mature AUV, Year 2 at 78%, Year 3 at 88%, Year 4 at 95%, Year 5 at 100%.
- Base scenario: Year 1 at 78% of mature AUV, Year 2 at 88%, Year 3 at 95%, Year 4 at 100%, Year 5 at 102%.
- Optimistic scenario: Year 1 at 90% of mature AUV, Year 2 at 95%, Year 3 at 100%, Year 4 at 105%, Year 5 at 110%.
The table below shows how these scenarios translate into projected annual revenue for a franchise with a mature AUV of $1,000,000.
| Year | Conservative | Base | Optimistic |
|---|---|---|---|
| Year 1 | $650,000 | $780,000 | $900,000 |
| Year 2 | $780,000 | $880,000 | $950,000 |
| Year 3 | $880,000 | $950,000 | $1,000,000 |
| Year 4 | $950,000 | $1,000,000 | $1,050,000 |
| Year 5 | $1,000,000 | $1,020,000 | $1,100,000 |
Break-even timing typically falls between 18 and 42 months depending on the franchise category and local market conditions. Stress-testing your model with downside scenarios 15%–25% below base assumptions identifies whether a deal only works at average performance or survives real-world volatility. Deals that only pencil out at the optimistic scenario are fragile. Deals that survive the conservative case are worth pursuing.
Pro Tip: Run your break-even calculation using the conservative scenario revenue and actual fixed costs. If the unit cannot service debt and cover operating expenses at 65% of AUV, the site or the deal structure needs to change before you sign.
What techniques improve accuracy in franchise revenue forecasting?
Best-in-class forecasting targets variance below 5% between projected and actual revenue. That benchmark is achievable only when you combine quantitative time-series analysis with qualitative pipeline-weighted probability modeling. Time-series analysis uses historical unit performance to project forward. Pipeline weighting assigns probability scores to deals in your development pipeline, so your aggregate forecast reflects realistic close rates rather than every deal at 100%.
Avoiding false precision is as important as building the model itself. Single-point estimates, one number for Year 1 revenue, create false confidence. Probability ranges communicate the actual uncertainty in your projections and force honest conversations with lenders and investors. A range of $650,000–$900,000 for Year 1 is more credible than a single figure of $780,000 with no context.
"Forecast variance under 5% is a hallmark of best-in-class revenue forecasting, achieved through combining historical trend data with weighted probability analytics. Modern forecasting is a continuous process, not a static annual report."
Technology now supports real-time forecasting updates. Analytics platforms that pull live unit performance data allow franchisors to recalibrate projections as new information arrives, rather than waiting for an annual review. Quarterly forecast reviews catch small errors before they compound into large financial losses. A 3% variance left uncorrected for three quarters becomes a structural problem that distorts your entire expansion plan.
- Variance tracking: Measure actual vs. projected revenue monthly and flag anything above 5%.
- Pipeline-weighted modeling: Score each deal in your development pipeline by close probability before including it in aggregate forecasts.
- Probability ranges: Replace single-point estimates with conservative-to-optimistic ranges in every investor and lender presentation.
- Real-time analytics: Use platforms that update unit performance data continuously, not just at quarter-end.
- Quarterly recalibration: Review and adjust all three scenarios every 90 days as market conditions and unit data evolve.
You can learn more about calculating franchise profitability with the methods that keep variance low across a growing unit portfolio.
How do you build franchise revenue forecasts that support financing?
Lenders do not fund revenue projections. They fund proof of debt serviceability and cash flow runway. Franchise revenue forecasts used for financing must incorporate FDD Items 19 and 10, realistic operating expense assumptions, and a clear timeline to break-even. The forecast must show that the unit generates enough cash to cover royalties, advertising fund contributions, labor, rent, and debt service, not just gross revenue.
Build your financing model in this sequence:
- Set gross revenue by scenario: Use the three-scenario ramp table as your starting point.
- Deduct royalties and ad fund fees: These are typically 5%–8% of gross revenue and must appear as line items, not footnotes.
- Model fixed and variable operating costs: Labor, occupancy, and supplies each behave differently as revenue scales.
- Calculate EBITDA by scenario: Earnings before interest, taxes, depreciation, and amortization is the figure lenders scrutinize most.
- Apply debt service: Show the annual loan payment against EBITDA to demonstrate coverage ratio.
- Project cash flow timeline: Map the month-by-month cash position from opening through break-even.
Payback period and internal rate of return (IRR) complete the picture for equity investors. Payback period tells investors how long before they recover their initial capital. IRR expresses the annualized return on that capital across the full investment horizon. Both metrics require the same three-scenario structure so investors can evaluate upside potential against downside risk.
Brands that prioritize unit economics over raw growth prove more resilient when labor costs and inflation compress margins. A financing model that only works under optimistic assumptions will not survive lender scrutiny. Build the base case conservatively, and let the upside case speak for itself. For a deeper look at preparing your financial package, the guide on franchise financing strategies covers the documentation lenders expect in 2026.
Key Takeaways
Accurate franchise expansion revenue forecasting requires median-based baselines, segmented revenue streams, three-scenario ramp modeling, and continuous variance tracking below 5% to support both operations and financing decisions.
| Point | Details |
|---|---|
| Use median, not average | Only 40.8% of units beat the system average, so median revenue produces more realistic forecasts. |
| Apply ramp-up curves | Year 1 revenue typically runs 65%–90% of mature AUV; assuming full maturity immediately creates liquidity risk. |
| Model three scenarios | Conservative, base, and optimistic projections give lenders and investors a credible range, not false precision. |
| Track variance quarterly | Best-in-class forecasting targets below 5% variance; quarterly reviews prevent small errors from compounding. |
| Segment revenue streams | Royalties, sales, and subscriptions behave differently; mixing them masks trends that affect profitability decisions. |
Where most franchise revenue forecasts go wrong
The most common mistake I see franchisors make is treating the forecast as a one-time document. They build a model before signing the FDD, file it with their financing application, and never touch it again. By month six, the actual unit performance has diverged from the projection, but no one has updated the model. By month twelve, the variance is large enough to affect real decisions, and the franchisor is flying blind.
The second mistake is the "average-only" fallacy. Franchisors pull the headline AUV from Item 19, apply it to every new unit, and call it a forecast. That number includes your top performers. It includes units in markets with no comparable competition. It includes franchisees who have been operating for a decade. A new unit in a new market with a new franchisee will not perform like your system average for at least two to three years. Using the median and applying a ramp curve is not pessimism. It is accuracy.
I am also consistently surprised by how few franchisors separate their revenue streams before modeling. A brand that earns royalties, sells proprietary products to franchisees, and charges technology fees has three distinct revenue curves. Blending them into one line produces a number that looks clean but tells you nothing about which stream is growing, which is stalling, and which is at risk. Separate streams give you the visibility to act before a problem becomes a crisis.
The franchisors who get this right share one habit: they treat forecasting as a living process. They update their models with real unit data every quarter, recalibrate their scenarios when market conditions shift, and stress-test every new deal against the conservative case before committing. That discipline is what separates brands that scale sustainably from those that grow fast and then contract.
— Cody
How Franchise Fast Track supports your expansion pipeline
Accurate revenue forecasts depend on a reliable pipeline of qualified franchisees. A forecast built on optimistic close assumptions collapses the moment your development pipeline stalls.

Franchise Fast Track delivers hundreds of monthly appointments with verified high-income professionals earning $150,000–$500,000 annually, the buyers whose financial profiles actually support the unit economics your forecasts are built on. With a reported lead-to-close rate of 34%, the platform gives your franchise development team the pipeline data needed to build realistic, probability-weighted revenue projections. For franchisors who want to understand key modeling terms before building their next forecast, the Franchise Glossary covers every term from AUV to IRR in plain language.
FAQ
What is franchise expansion revenue forecasting?
Franchise expansion revenue forecasting is the process of estimating future revenues during franchise growth using FDD Item 19 data, industry AUV benchmarks, and structured financial modeling across conservative, base, and optimistic scenarios.
How do I forecast franchise revenue without Item 19 data?
When Item 19 is not disclosed, use industry AUV benchmarks with a three-scenario approach: conservative at 65%, base at 78%, and optimistic at 90% of mature AUV for Year 1, reaching maturity within 12–24 months.
What variance target should franchise revenue forecasts hit?
Best-in-class franchise revenue forecasting targets variance below 5% between projected and actual revenue, achieved by combining time-series historical data with pipeline-weighted probability modeling and quarterly recalibration.
Why do lenders focus on break-even timing in franchise forecasts?
Lenders focus on break-even and cash flow payback timing because those metrics prove debt serviceability. A revenue projection alone does not confirm that the unit generates enough cash to cover royalties, operating costs, and loan payments.
How often should franchise revenue forecasts be updated?
Franchise revenue forecasts require quarterly updates to prevent small errors from compounding into large financial losses. Modern forecasting treats projections as a continuous process, not a static annual document.
Recommended
- Emerging Franchise Brands: Your 2026 Investment Guide | Franchise Fast Track Blog
- What Is the Franchise Fee? Definition & 2026 Insights | Franchise Fast Track Blog
- Proven Franchise Growth Strategies for 2026 | Franchise Fast Track Blog
- Financing for a Franchise: Franchisor's 2026 Guide | Franchise Fast Track Blog
Ready to see results like these for your franchise?
Stop wasting money on leads that never close. Start getting hundreds of replies from high-net-worth professionals daily.