How Long Until a Franchise Breaks Even? Cash Flow Timelines
Most brick-and-mortar franchises take 12 to 24 months to reach cash-flow break-even, not the three months of runway that FDD Item 7 typically covers. That gap is where most new owners get into trouble. The formula that closes it is simple: monthly cash burn × realistic break-even months × 1.2 to 1.3 contingency.
Run that math before you sign anything.
- Service and home-based concepts: often 6-12 months to stabilize
- QSR and fast-casual: commonly 12-18 months
- Full-service restaurants and fitness/retail buildouts: frequently 18-24 months
The number that matters most: if your monthly burn is $18,000 and your realistic break-even sits at a typical timeframe in the range of over a year, your working capital target should be calculated accordingly, not just based on the three months of Item 7 disclosure. Build a 13-week rolling forecast this week and calculate your actual monthly burn before you calculate anything else.
Key Takeaways
Franchise cash-flow break-even typically takes 12 to 24 months, and the working capital formula (monthly burn times realistic months times a 1.2 to 1.3 contingency) is the single calculation every new owner should run before signing.
| Point | Details |
|---|---|
| Break-even range | Most brick-and-mortar franchises reach cash-flow break-even in 12-24 months, not the 3 months Item 7 covers. |
| Working capital formula | Multiply monthly cash burn by realistic break-even months, then apply a 1.2 to 1.3 contingency multiplier. |
| Revenue ramp reality | New units often open at 60-70% of mature revenue and take 12-18 months to stabilize. |
| Forecasting cadence | A 13-week rolling cash forecast, updated weekly, catches cash pressure that monthly P&L reviews miss. |
| Franchisor validation | Franchise Fast Track connects franchisors with income-verified buyers who understand real capital requirements before signing. |
Table of Contents
- Franchise Cash Flow Timeline Examples From Signing to Month 18
- How Do You Calculate Real Working Capital Need?
- What Revenue Ramp Should You Actually Expect?
- Why a 13-Week Rolling Cash Forecast Beats a Monthly Budget
- Which Habits Actually Protect Your Cash Position?
- How to Turn Item 7 and Item 19 Into a Real Timeline
- Worked Scenarios: Two Categories, Two Timelines
- Item 7 Additional Funds vs. Your Actual Runway Need
- What Cash Flow Problems Actually Look Like in Year One
- How Much Does Seasonality Shift Your Break-Even Date?
- How Grand Opening Spending Shapes Your First Six Months
- Managing Cash Flow Across Multiple Units
- Case Studies: Comparing Timelines Across Franchise Categories
- Three Mistakes Operators Keep Repeating
- How Franchise Fast Track Helps Franchisors Set Realistic Cash Assumptions
- Frequently Asked Questions
- Sources
Franchise Cash Flow Timeline Examples From Signing to Month 18
Cash events don't arrive evenly. They cluster, and the clusters can bury an underfunded owner. Here is the realistic sequence.
- Pre-signing (Week 0): Franchise fee deposit, often 20-50% of the total fee, due at signing. Legal review and site-selection deposits often follow within days.
- Buildout (Months 1-4): Vendor payments front-loaded, equipment deposits, leasehold improvements, and pre-opening payroll and training costs, all outflows, zero revenue.
- Grand opening (Month 4-5): Marketing spend spikes, inventory purchases balloon, and first payroll runs hit before first meaningful receivables land.
- Months 1-6 post-opening: Revenue typically runs well below mature levels while fixed costs (rent, loan payments, insurance) stay flat. This is the most cash-negative stretch for most concepts.
- Months 6-18: Revenue climbs toward maturity, but royalty payments (often due on billed revenue, not collected cash) and loan amortization create timing mismatches where a profitable month still drains the bank account.
Seasonal troughs inside that window (a slow Q1 for a fitness concept, a soft summer for a tutoring brand) can stretch the timeline further. Map your specific category's seasonality onto this skeleton before you finalize your capital target.
How Do You Calculate Real Working Capital Need?
Monthly cash burn isn't your P&L expense line. It's every dollar leaving the account: rent, payroll, cost of goods sold, royalty and ad fund payments, loan principal and interest, and vendor prepayments your supplier agreement requires before goods ship.
The formula stays consistent across categories:
- Monthly cash burn (all-in, including debt service)
- × realistic break-even months (use category benchmarks, not the franchisor's best-case pitch)
- × 1.2 to 1.3 contingency multiplier
The contingency isn't padding for comfort. It exists because Item 7 disclosures typically understate real-world cash needs, and because ramp periods rarely go exactly to plan.
A low-overhead service unit (home-based, one owner-operator, minimal buildout): monthly burn around $6,500, realistic break-even at 9 months. That's $6,500 × 9 × 1.25 = $73,125.
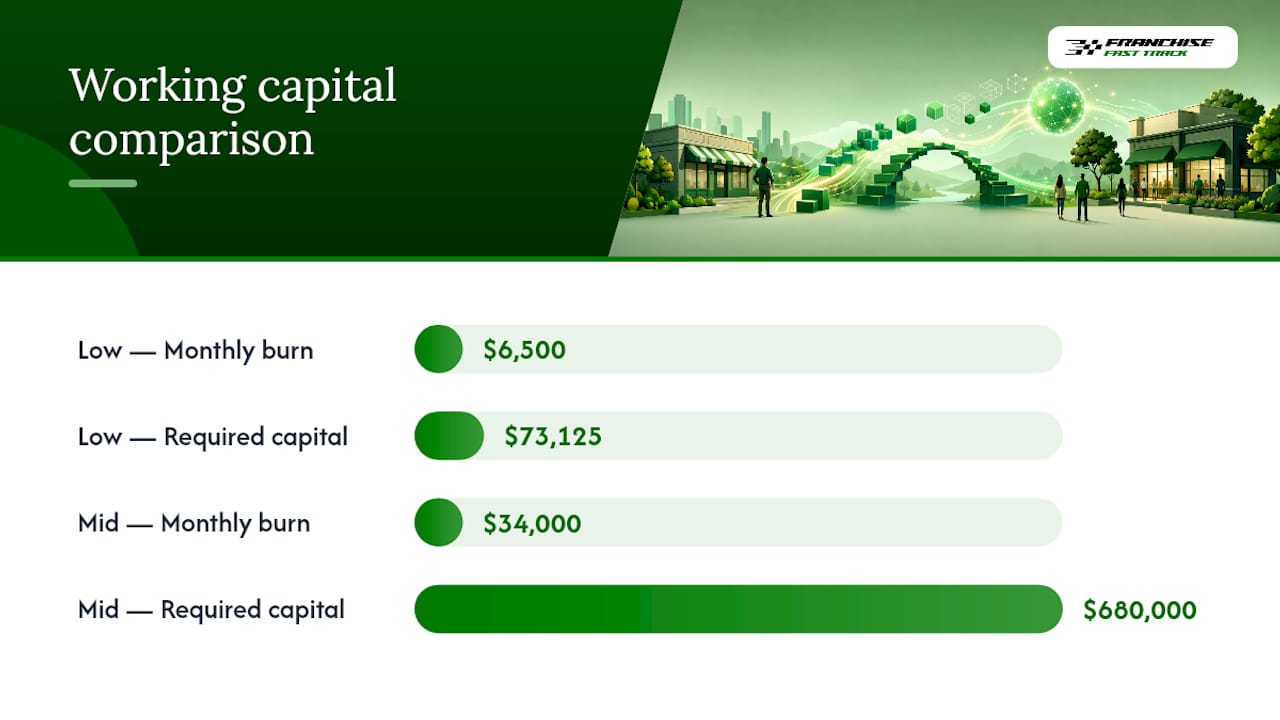
A mid-range fast-casual location with a lease, equipment financing, and a staff of 12: monthly burn around $34,000, realistic break-even at 16 months. That's $34,000 × 16 × 1.25 = $680,000.
The gap between those two numbers is the entire reason category matters more than franchise fee size when you're budgeting.
Pro Tip: *Calculate your working capital number twice, once using the franchisor's Item 19 projections and once using the most conservative comparable franchisee data you can find.
What Revenue Ramp Should You Actually Expect?
New units commonly open at 60-70% of mature-unit revenue and take 12 to 18 months to climb toward stabilized volume. Franchisors rarely lead with this number because it makes the Item 19 projections look less exciting, but it's the figure that should drive your royalty and cash calculations, not the mature-unit average.
Category benchmarks vary widely:
- Service and home-based brands: often reach 70-80% of mature volume within 6-9 months, thanks to lower fixed costs and faster local marketing traction
- QSR: typically 60-70% of mature volume by month 6, climbing to 85-90% by month 12
- Fast-casual: slower ramps, often 55-65% by month 6, with full stabilization taking 15-18 months
- Retail and fitness: highly dependent on pre-sale campaigns and membership drives before doors open, so ramp speed swings widely by brand
- Full-service restaurants: frequently the slowest category to stabilize, often 18-24 months, given staffing complexity and word-of-mouth dependency
Analysis of hundreds of FDDs shows payback timelines vary enormously by category, with some categories (senior care, for instance) showing far longer runways to profitability than others (certain fitness concepts). Brand strength, local pre-sale campaigns, seasonality, and vendor payment terms all push these ranges in either direction.
Before you finalize your own assumptions, call three to five existing franchisees who opened in the last two years and ask them directly what percentage of mature revenue they hit by month 6, 12, and 18. Franchisor-provided averages smooth over the variance that actually matters to your cash position.
Why a 13-Week Rolling Cash Forecast Beats a Monthly Budget
A monthly P&L tells you whether the business model works. It tells you almost nothing about whether you'll have enough cash on the 15th of next month to cover payroll. A 13-week rolling forecast, updated weekly, closes that gap by giving you near-term visibility without demanding the false precision of a 12-month projection.
Build it with these minimum fields:
- Projected receipts, broken out by week (or by day for cash-heavy retail concepts)
- Payroll schedule, mapped to actual pay dates, not accrual periods
- Vendor payment terms, matched to when invoices are actually due
- Royalty and ad fund payments, timed to your franchisor's actual billing cycle
- Loan payments, principal and interest broken out separately
Two quick examples show why the terms matter as much as the totals.
| Franchise type | Payment terms | Cash timing effect |
|---|---|---|
| Service franchise (Net 30 vendors) | Pays vendors 30 days after invoice | Cash outlay lags expense recognition by roughly a month, smoothing weekly pressure |
| QSR (COD supplier terms) | Pays for inventory on delivery | Cash leaves the account immediately, tightening weekly cash even when sales are strong |
A brand like a financial forecasting template built for small businesses can give you the skeleton, but franchise-specific royalty and ad fund timing has to be layered in manually. The Franchise Fast Track blog's revenue forecasting guide walks through ramp assumptions in more depth if you want to build your own model from scratch.
Which Habits Actually Protect Your Cash Position?
Franchise cash flow management comes down to a handful of repeatable habits, not complicated software.
- Check your bank balance daily, not weekly. It takes two minutes and catches problems before they compound.
- Review your top five inflows and outflows every week, so you notice a slipping trend before it becomes a crisis.
- Trim recurring subscriptions and software costs quarterly. Small monthly charges add up faster than owners expect.
- Keep a royalty float, a dedicated buffer equal to one month of royalty payments, so a slow week doesn't force you to choose between payroll and your franchisor.
- Use surplus cash intentionally. Pay down high-interest debt or build the float rather than letting a good month disappear into general spending.
These aren't complicated moves, but tracking top inflows and outflows weekly is one of the highest-leverage habits available to a new owner, according to franchise operations coverage.
On the tactical side, negotiate extended vendor terms before you open, not after you're behind. Ask your lender about an interest-only ramp period on your SBA loan during the first 6-12 months. And if you're in a membership or subscription-style concept, pre-sell before opening day to bank cash ahead of your heaviest outflow period.
Pro Tip: Set a hard trigger, not a feeling, for when to call your advisor or franchisor: two consecutive weeks of negative cash variance against your 13-week forecast. Waiting for a "bad feeling" costs you the weeks you need to act.
How to Turn Item 7 and Item 19 Into a Real Timeline
Item 7 lists your estimated initial investment, including a line for "additional funds," which typically covers about three months of operating expenses. Item 19 gives financial performance representations, when the franchisor chooses to disclose them, usually based on existing unit averages rather than new-unit ramp behavior.
Neither line is built to tell you how long your specific unit will take to break even. Treat both as a starting point, not a forecast.
A short conversion checklist:
- Take the Item 7 "additional funds" figure and divide it by three to find the franchisor's implied monthly burn assumption
- Compare that number against your own calculated monthly burn, including debt service the franchisor's estimate may exclude
- Ask Item 19 for the underlying unit count and average unit age; older, mature units skew the average upward
- Request month-by-month, not annual, revenue data from at least three recent franchisees
Questions worth asking directly: "What was your revenue in months 3, 6, 9, and 12?" "Did you use the additional funds allocation, or did you need more?" "What surprised you about vendor payment timing?" The three-threshold break-even framework, separating operational, cash-flow, and investment break-even, gives you a cleaner structure for organizing whatever answers you get. The Franchise Fast Track glossary covers Item 7 and Item 19 definitions if you need a quick reference while you're reading disclosure documents.
Worked Scenarios: Two Categories, Two Timelines
Working capital target: roughly $73,000.
- Months 1-3: revenue near 40% of mature, cash deeply negative
- Months 4-8: climbing toward 70%, royalty timing tightens weekly cash
- Month 9: break-even, assuming Net 30 vendor terms hold
Scenario B, mid-range fast-casual: same ramp curve, but COD supplier terms versus Net 30 shift the break-even point by roughly one to two months, since cash leaves faster than it does under extended terms.
Franchisors rarely volunteer how much COD terms alone can shift your break-even date. That single vendor-negotiation point is worth more than most owners realize.
Item 7 Additional Funds vs. Your Actual Runway Need
Item 7's "additional funds" line is a legal disclosure requirement, not a working capital projection. Franchisors typically calculate it to cover roughly three months of operating costs, a number chosen to satisfy Federal Trade Commission disclosure rules, not to reflect how long your specific market and category actually take to stabilize.
Real runway needs to account for the full ramp period, not a fixed disclosure window. If your category typically takes 15 months to reach cash-flow break-even and Item 7 only funds three, you're short by 12 months of burn the moment you open your doors. That's the single most common underfunding mistake among new franchise owners, and it's baked into how the disclosure document is structured, not a mistake franchisors are hiding.
The practical fix is treating Item 7 as a floor, not a target. Use it as one data point among several: your own calculated monthly burn, category-specific break-even benchmarks, and conversations with recent franchisees about what they actually spent before turning cash-flow positive. Some franchisors will privately acknowledge that their Item 7 number assumes an aggressive, best-case ramp. Ask directly whether the additional funds figure assumes best-case, average-case, or worst-case timing, and request the assumptions behind it in writing if you can get them.
The multiplier approach (monthly burn times realistic break-even months times a 1.2 to 1.3 contingency) exists specifically to correct for this structural gap between what Item 7 discloses and what your bank account will actually need to survive.
What Cash Flow Problems Actually Look Like in Year One
The most common early failure isn't a bad location or weak demand. It's a timing mismatch between when money goes out and when it comes in, and it shows up in predictable patterns.

Delayed buildout completion pushes back your grand opening while lease payments and loan interest keep accruing. A four-week construction delay can cost thousands in carrying costs before you've sold a single product.
Slow receivables collection hits B2B-facing franchise categories especially hard, cleaning, commercial services, staffing, where clients routinely pay on 30 to 60 day terms while your payroll and vendor bills stay due on their normal schedule.
Royalty payments calculated on billed revenue rather than collected cash create a gap where you owe your franchisor for sales you haven't been paid for yet. This is one of the more overlooked mechanics in franchise cash flow management, and it catches new owners who assumed royalties would track their bank balance.
Equipment breakdowns during the ramp period hit particularly hard because most new owners haven't built a repair reserve yet, forcing an unplanned outflow during the exact window when cash is already tightest.
Staff turnover during training and ramp-up forces repeated hiring and training costs before the unit has reached the revenue level needed to absorb them comfortably.
Each of these is manageable individually. The danger is when two or three compound in the same quarter, which is exactly why a weekly rolling forecast catches problems a monthly review misses.
How Much Does Seasonality Shift Your Break-Even Date?
Seasonality doesn't just soften a slow month, it can add several months to your break-even timeline if your grand opening lands in the wrong season for your category.
A fitness franchise opening in November faces a brutal stretch: holiday distractions suppress new memberships right as the January resolution surge, its biggest acquisition window, sits three to four months away. A landscaping or lawn-care franchise that opens in October may barely generate revenue until spring, stretching what looked like a 12-month break-even into 16 or 17 months simply because of calendar timing.
Tutoring and education franchises see the opposite pattern: enrollment spikes around the school year start and before standardized testing windows, then dips hard in summer. A tax preparation franchise lives almost entirely inside a four-month window each year, meaning your working capital calculation has to fund an entire off-season, not just a ramp period.
The fix isn't avoiding seasonal categories. It's building your 13-week forecast around your category's actual seasonal curve rather than a flat monthly average. If your category has a known trough, plan your contingency reserve to cover it specifically, and time your grand opening, when you have any control over it, to land just before your category's strongest season rather than its weakest.
How Grand Opening Spending Shapes Your First Six Months
Franchisors typically require a minimum grand opening marketing spend, often ranging from a few thousand dollars to well over $10,000 depending on the brand and market size, timed to hit right as you're already absorbing buildout costs and pre-opening payroll.

That spend is not optional in most franchise agreements, and it lands at the worst possible moment for cash: after buildout has drained your reserves and before revenue has started flowing.
The mistake many new owners make is treating grand opening marketing as part of their startup budget rather than a distinct line item with its own timing. Build it into your working capital calculation as a discrete outflow in month one or two, separate from your ongoing monthly burn. If your franchisor requires $8,000 in grand opening marketing and you've only budgeted your ongoing ad fund contribution, you're short by that exact amount at the exact moment your cash position is already thinnest.
The upside: brands with strong pre-sale or pre-opening campaigns, membership-based fitness concepts especially, often shorten their ramp period specifically because that upfront spend generates revenue commitments before the doors open. Ask your franchisor for data on how grand opening spend correlates with faster ramp in their specific system before you decide whether to spend the minimum or exceed it.
Managing Cash Flow Across Multiple Units
Cash flow discipline that works for one unit doesn't automatically scale to three or five. Rapid expansion multiplies the timing mismatches you already manage at one location, and it introduces a new one: capital gets pulled toward the newest unit's buildout right when an earlier unit still needs its own royalty float.
The core discipline is keeping each unit's cash forecast separate even while managing them under one ownership entity. Multi-unit operators who pool cash across locations without unit-level visibility often discover too late that unit three's buildout costs drained the reserve unit one needed for its own seasonal trough.
A practical structure: maintain a corporate reserve equal to one month of combined burn across all open units, separate from each unit's individual float. Sequence new unit openings so a new buildout doesn't launch while an existing unit is still inside its own break-even window, generally the first 12 to 18 months. And renegotiate vendor terms as volume grows. A five-unit operator has real leverage to move suppliers from COD to Net 30, which can meaningfully ease weekly cash pressure across every location at once.
Franchisors sometimes push development schedules that assume each new unit self-funds from the last one's profits. That works only once your first unit has genuinely cleared cash-flow break-even, not operational break-even. Confirm which threshold your franchisor is assuming before you commit to an aggressive multi-unit timeline.
Case Studies: Comparing Timelines Across Franchise Categories
Placing categories side by side shows how differently the same formula plays out depending on the business model.
A home-based service franchise (cleaning, pet care, tutoring) with a monthly burn near $6,000 to $8,000 often clears cash-flow break-even in 9 to 12 months. Low fixed costs and minimal buildout mean the working capital target rarely exceeds $100,000, and seasonal troughs, where they exist, tend to be shorter.
A QSR franchise with a monthly burn near $25,000 to $35,000 typically breaks even between 12 and 18 months. COD supplier terms and higher staffing costs push the working capital target toward $400,000 to $600,000 depending on market and lease terms.
A fitness franchise with heavy pre-sale dependency shows the widest variance of any category. Units with strong pre-opening membership campaigns sometimes reach break-even in 10 to 12 months, while those without can stretch past 20 months, almost entirely a function of pre-sale execution rather than the underlying business model.
A full-service restaurant, the slowest category on average, commonly takes 18 to 24 months given staffing complexity, higher buildout costs, and word-of-mouth-dependent customer acquisition. Working capital targets here frequently exceed $700,000 once contingency is applied.
The pattern across every category: the formula stays constant, monthly burn times realistic months times contingency, but the inputs swing by a factor of five or more depending on business model. That is the entire argument for calculating your own numbers rather than borrowing a friend's franchise's timeline.
Three Mistakes Operators Keep Repeating
Three mistakes show up again and again: undercapitalizing based on Item 7's three-month figure, trusting franchisor averages that blend mature and new units together, and ignoring the timing mismatch between P&L profit and actual cash in the bank.
The fix isn't more optimism or a bigger loan. It's one discipline: run a weekly rolling 13-week forecast and keep a royalty float on hand. Owners who adopt that single habit catch problems months before owners relying on monthly P&L reviews even notice something's wrong.
How Franchise Fast Track Helps Franchisors Set Realistic Cash Assumptions
Everything above is aimed at franchise buyers building their own runway math. Franchisors face a parallel problem from the other side of the table: awarding units to buyers who haven't thought through their break-even timeline at all, which drives slow ramps, undercapitalized locations, and support-team fire drills that were entirely avoidable.
Franchise Fast Track approaches this differently than traditional franchise advertising or broker networks. Instead of generic leads, it delivers appointments with verified high-income professionals earning $150K to $500K annually, buyers with the financial depth to actually fund a realistic working capital target rather than stretching to cover just the franchise fee.

That income verification matters directly for the cash-flow math in this article. A buyer who can only fund three months of Item 7's additional funds is a buyer heading toward the exact undercapitalization problem outlined above. Franchisors using Franchise Fast Track report a 34% lead-to-close rate, largely because the buyers arriving on the calendar already understand capital requirements before the first conversation happens.
If your development team is spending more time re-explaining break-even timelines to underqualified leads than closing awards with buyers who already get it, explore franchise lead generation built specifically around that qualification bar.
Frequently Asked Questions
How long does it typically take a franchise to reach cash-flow break-even?
Most brick-and-mortar franchises reach cash-flow break-even in 12 to 24 months, with service and home-based concepts often on the faster end and full-service restaurants on the slower end.
What's the difference between operational break-even and cash-flow break-even?
Operational break-even means revenue covers operating costs on paper. Cash-flow break-even means the bank account itself stops declining, a distinction the three-threshold framework treats as separate milestones with different timelines.
Does Item 7's "additional funds" line cover my full working capital need?
Rarely. It typically covers about three months of costs, while realistic break-even often takes four to eight times longer, which is why the 1.2 to 1.3 contingency multiplier exists.
How often should I update my cash flow forecast during ramp-up?
Weekly, using a rolling 13-week forecast rather than a static monthly budget, since royalty and payroll timing can create weekly deficits a monthly view won't show.
What's the biggest cash flow mistake new franchise owners make?
Using Item 7's disclosed additional funds figure as their actual working capital target instead of calculating their own monthly burn against a realistic, category-specific break-even timeline.
Sources
For deeper benchmarking, see FranchiseIQ's break-even timeline guide and Franchise Fast Track's revenue forecasting guide and startup cost benchmarking guide.
- Franchise Working Capital & Break-Even Timeline: How Much Cash You Really Need Before Profit | FranchiseIQ
- Franchise Cash Flow Management: Surviving Months 1–18 and Building Predictability | FranchiseVS
- Franchise Cash Flow Planning Guide for Owners | QMK Consulting
- Franchising
- Break-Even Analysis for Franchise Owners: The Three Thresholds Every Buyer Should Model Before Investing | Franchise Grade
Recommended
Ready to see results like these for your franchise?
Stop wasting money on leads that never close. Start getting hundreds of replies from high-net-worth professionals daily.