What Does Franchise Investment Return Mean for Owners?
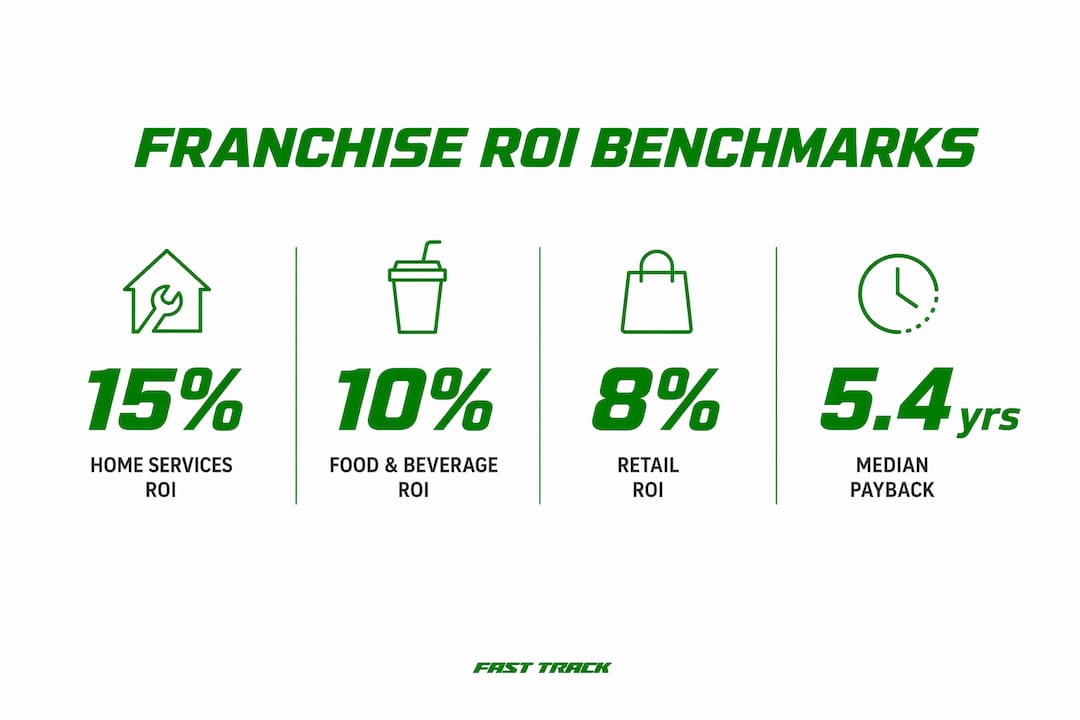
Franchise investment return is defined as the percentage of profit you earn relative to the total capital you put into a franchise, and it is the single most important metric for evaluating whether a franchise opportunity is worth pursuing. The industry standard term is return on investment, or ROI, calculated as annual net profit divided by total initial investment. Experts consider a solid annual franchise ROI to be 15% or higher, with well-run units typically delivering 15–20% annually. Typical payback periods run 2–5 years, though averages across a broad sample of brands can stretch to 5–6 years. Understanding what drives those numbers, including royalties, operating costs, and exit value, is what separates informed buyers from disappointed ones.
What does franchise investment return mean and how is it calculated?
Franchise ROI measures how efficiently your invested capital generates profit. The base formula is straightforward: divide annual net profit by total initial investment, then multiply by 100. If you invest $200,000 and earn $40,000 in net profit per year, your annual ROI is 20%.

That single number, however, tells only part of the story. Franchise ROI comprises three components: annual Cash-on-Cash Return, long-term Equity Appreciation, and exit proceeds. Focusing only on annual income causes most buyers to underestimate their total return by a wide margin.
Two additional screening metrics sharpen the picture before you commit:
- Cash-on-cash return: Annual pre-tax cash flow divided by total cash invested. This isolates how much actual cash the business returns each year, separate from paper profits.
- Revenue-to-investment ratio: Total annual revenue divided by your initial investment. A ratio above 2x signals faster payback. A ratio above 2x reliably indicates payback within 3–4 years, while below 1x usually means an extended wait.
Royalties typically range 4–8% of gross revenue, and marketing fees add another 1–4%. These ongoing fees act like a permanent tax on revenue. A franchise generating $500,000 in annual revenue could pay $25,000–$60,000 in royalties alone before you account for labor, rent, or supplies.
Pro Tip: Review FDD Item 19 disclosures carefully and call at least 10 existing franchisees before building your financial model. Franchisee interviews reveal real operating costs that averages in the disclosure document often obscure.
What are typical franchise ROI benchmarks by industry?
ROI benchmarks vary sharply by franchise category. Home services franchises, which require lower capital and minimal physical space, consistently outperform capital-heavy categories like quick-service restaurants and hospitality.
The median revenue-to-investment ratio across 126 brands is 1.4x, while strong home services performers achieve ratios of 5–10x. Capital-heavy franchises frequently fall below 1x. That gap translates directly into how long you wait to recover your initial outlay.
| Franchise category | Typical annual ROI | Revenue-to-investment ratio | Median payback period |
|---|---|---|---|
| Home services | 20–30%+ | 5–10x | 2–3 years |
| Personal care and wellness | 15–20% | 2–4x | 3–4 years |
| Food and beverage (QSR) | 10–18% | 0.8–1.5x | 4–6 years |
| Hospitality and lodging | 8–14% | Below 1x | 6+ years |
| Business services | 15–25% | 2–5x | 2–4 years |
The median payback period across the broader franchise market is 5.4 years, with a mean of 6.2 years. That figure surprises many first-time buyers who expect faster results. High-capital categories drive that average up significantly, which is why screening by revenue-to-investment ratio before falling in love with a brand name is a discipline worth building early.
Semi-absentee ownership models, where you hire a manager and stay out of daily operations, typically produce lower but steadier returns in the 5–12% range. Full owner-operator involvement tends to push returns toward the higher end of the 15–20% band.
How does franchise ROI compare to other investments?
Franchise ownership is an active investment, and that distinction matters when you set return expectations. Index funds have historically yielded around 10% annually with zero management effort. Franchise ROI for actively managed units should exceed passive returns by 5–8 percentage points to justify the time, risk, and capital commitment. That means a cash-on-cash return below 12% is often a poor deal given the 50–60 hours per week many franchise owners invest.
The risks that justify a higher return target include:
- Illiquidity: Franchise investments cannot be sold in an afternoon the way stocks can. Exit timelines typically run 6–18 months.
- Royalty obligations: Fees continue regardless of profitability, creating a fixed cost burden that passive investments do not carry.
- Operational time commitment: Owner-operator models demand full-time involvement, which has a real opportunity cost.
- Market variability: Location, local competition, and economic conditions affect individual unit performance far more than system-wide averages suggest.
- Debt service: Financing a franchise purchase adds monthly loan payments that reduce cash-on-cash returns, sometimes dramatically.
Franchise debt service and operating expenses can significantly reduce cash-on-cash returns, which is why building a conservative financial model before signing matters more than any sales presentation. You can learn more about specific franchise investment risks that affect net returns before committing capital.
Pro Tip: Model your projections at 80% of the franchisor's stated average revenue. If the business still works at that reduced figure, the investment has a reasonable margin of safety. If it only works at peak performance, reconsider.
What practical steps help you evaluate and maximize your return?
Evaluating franchise financial returns requires more than reading a brochure. A structured due diligence process protects your capital and sets realistic expectations before you sign a franchise agreement.
- Validate FDD Item 19 with franchisee calls. The Franchise Disclosure Document's Item 19 contains financial performance representations, but averages mask wide variation. Call franchisees in markets similar to yours and ask about actual net profit, not gross revenue.
- Build a bottom-up profit and loss model. List every cost category: labor, royalties, marketing fees, rent, utilities, insurance, and debt service. Bottom-up P&L modeling reveals operational reality far more accurately than top-line revenue figures.
- Factor in exit value from day one. Most investors neglect exit valuation, which can double or triple total returns. A franchise earning $80,000 annually over 8 years plus a sale at 4x Seller's Discretionary Earnings ($320,000) produces a 274% total return, roughly 17% annualized. That math changes how you evaluate a deal.
- Choose location with discipline. Traffic patterns, local demographics, and proximity to competitors affect unit-level performance more than brand strength alone. Operators in strong locations consistently outperform system averages.
- Track key performance indicators monthly. Cost of goods sold, labor as a percentage of revenue, and customer acquisition cost are the three metrics that most directly predict whether your ROI will land at the top or bottom of the range.
- Understand your operational involvement level. Decide before you buy whether you will be an owner-operator or semi-absentee. That choice shapes your expected return range and your hiring needs from day one.
Reviewing how franchise profitability is calculated in detail gives you a stronger foundation for building that financial model accurately.
Key Takeaways
Franchise investment return is best understood as a combination of annual cash-on-cash return, equity growth, and exit proceeds, not just yearly income.
| Point | Details |
|---|---|
| ROI definition | Annual net profit divided by total investment, expressed as a percentage. |
| Benchmark target | Aim for 15% or higher annually; below 12% rarely justifies active management effort. |
| Payback period reality | Median payback across the franchise market is 5.4 years, not the 2-3 years often cited. |
| Exit value matters | A sale at 4x SDE can double or triple total returns beyond operating income alone. |
| Royalties reduce returns | Fees of 5–12% of gross revenue are permanent costs that must be modeled before investing. |
The number that most franchise buyers get wrong
The ROI conversation almost always focuses on year one cash-on-cash return. That is the wrong place to start. The real wealth in franchise ownership comes from the exit, and most buyers never model it at all.
I have seen buyers walk away from a franchise earning 14% annually because it felt "too low," only to overlook that the same business was growing 8% per year and would sell at 3x earnings in five years. The total annualized return on that deal was closer to 22%. The annual income number alone told a misleading story.
The other mistake I see constantly is trusting system averages. A franchisor's reported average unit volume is a mean across hundreds of locations, many of which are in different markets, at different stages of maturity, and run by operators with wildly different skill levels. The franchisee in a saturated urban market and the one in a growing suburb are not the same investment. Call the ones in markets that actually resemble yours.
Patience is also underrated. A 5-year payback period sounds long until you compare it to the 7-year average for a small business built from scratch, with no brand support, no proven systems, and no training program. Franchise ownership is not a shortcut, but it is a more predictable path when you do the work upfront.
— Cody
How Franchise Fast Track connects franchisors with funded buyers
Attracting the right franchisees is what separates franchise systems that grow from those that stagnate. When franchisors work with underfunded or unqualified buyers, unit-level returns suffer and the whole system weakens.
Franchise Fast Track uses a proprietary system to deliver appointments with verified high-income professionals earning $150,000–$500,000 annually, including executives, directors, and senior managers actively seeking franchise ownership. The platform reports a lead-to-close rate of 34%, which reflects the quality of buyers entering the pipeline rather than just the volume. For franchisors who want to build a network of financially capable operators, Franchise Fast Track's franchise lead generation service replaces broad advertising with targeted outreach to buyers who are ready to invest.
FAQ
What is the basic formula for franchise ROI?
Franchise ROI equals annual net profit divided by total initial investment, multiplied by 100. A $200,000 investment generating $40,000 in net profit produces a 20% annual ROI.
What is a good franchise ROI?
Experts consider 15% or higher a solid annual return for a well-run franchise unit. Returns below 12% cash-on-cash rarely justify the time and risk of active ownership compared to passive alternatives.
How long does it take to recoup a franchise investment?
The median payback period across a broad sample of franchise brands is 5.4 years, with a mean of 6.2 years. Home services franchises with high revenue-to-investment ratios can pay back in 2–3 years.
How do royalties affect franchise investment returns?
Royalties of 4–8% of gross revenue plus marketing fees of 1–4% reduce net profit permanently. On a $500,000 revenue unit, that amounts to $25,000–$60,000 per year before any other operating costs.
Why does exit value matter for franchise ROI?
A franchise sale at 2–4x Seller's Discretionary Earnings can double or triple total lifetime returns beyond annual income alone. Buyers who model exit value from the start make more accurate investment decisions.
Recommended
Ready to see results like these for your franchise?
Stop wasting money on leads that never close. Start getting hundreds of replies from high-net-worth professionals daily.