Edibles Fruit Bouquets: Franchise Unit Economics
A 2025 franchise-data profile puts average 2023 gross revenue for established Edible Arrangements units at $538,107, while the brand's network fell from 791 locations in 2023 to 680 in 2024, a contraction of approximately 14 percent (Franchise Database profile). That combination reframes edibles fruit bouquets as a perishable retail system requiring retention analysis, not a visually differentiated gifting concept.
For franchise development executives and private equity analysts, the central question isn't whether fruit arrangements attract occasion-based demand. It's whether reported unit revenue can withstand food waste, labor intensity, delivery constraints, and franchisee churn. Item 19 revenue representations and Item 20 outlet disclosures provide the clearest starting point.
Table of Contents
- Edibles Fruit Bouquets Revenue and Network Contraction
- Historical Scaling of the Perishable Gifting Model
- Analyzing FDD Item 20 Churn and Unit Turnover
- Navigating FTC Compliance for Perishable Retail Investments
- Cold Chain Logistics and Operational Margin Pressures
- Data-Driven Outbound Development for Retail Concepts
Edibles Fruit Bouquets Revenue and Network Contraction
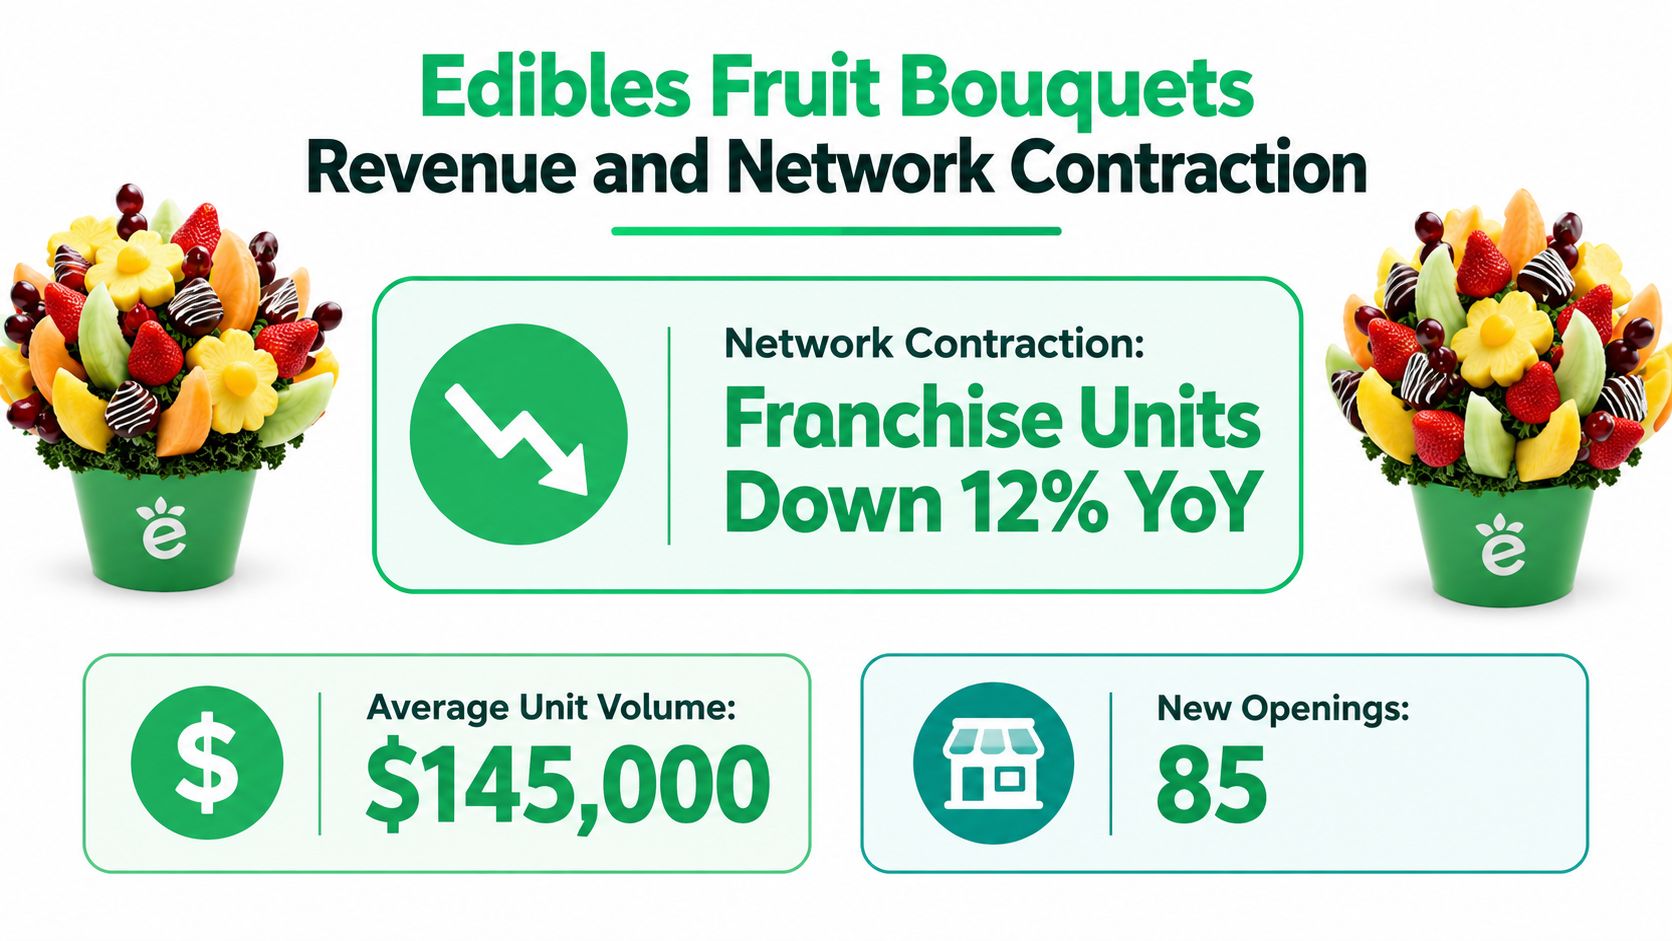
The reported $538,107 average gross revenue for 2023 provides a useful top-line benchmark, but it does not establish profitability. The financial-performance representation covered 672 of 680 franchised Edible Arrangements businesses and reported median gross revenue of $515,984 (Franchise Database profile). The relatively narrow spread between average and median suggests that the reported population was not supported solely by a small number of extreme outliers. Gross revenue still excludes the costs that determine returns in perishable retail, including produce, preparation labor, refrigeration, packaging, delivery, spoilage, occupancy, royalties, and local marketing.
Network contraction adds a separate risk signal. Locations declined from 791 to 680, an approximately 14 percent decrease. The same 2025 profile therefore points to a system that can generate substantial unit-level sales while losing outlets. Closures, failed ownership transfers, weaker renewals, or development assumptions that exceeded local demand could each contribute to that result. The investment implication is narrower than a growth narrative: established units may have commercial scale, while future expansion depends on retention and territory quality.
Average revenue isn't owner earnings
A disciplined underwriting process separates reported revenue from the earnings conclusions it cannot support.
| Measure | Reported figure | Investment interpretation |
|---|---|---|
| Units in financial-performance representation | 672 of 680 | Broad coverage of the franchised population, but not proof of uniform profitability |
| Average 2023 gross revenue | $538,107 | Top-line benchmark, not cash flow or owner earnings |
| Median 2023 gross revenue | $515,984 | Useful central tendency for unit-level comparison |
| Network locations in 2023 | 791 | Historical system footprint |
| Network locations in 2024 | 680 | Evidence of material contraction |
| Network change | Approximately 14 percent decrease | Requires Item 20 analysis before any expansion conclusion |
The average and median should anchor a model rather than complete it. A buyer would need to reconcile Item 19 with Item 7 investment requirements and Item 21 financial statements, then test whether reported revenue converts into four-wall contribution after cold-chain and delivery costs.
Contraction also changes the meaning of available territory. Open whitespace may represent genuine demand, or it may reflect weak delivery economics, operator fatigue, demand gaps, or a mismatch between national standards and local execution. Development teams should forecast franchise expansion revenue only after distinguishing attractive whitespace from territory released by franchisee distress.
Historical Scaling of the Perishable Gifting Model
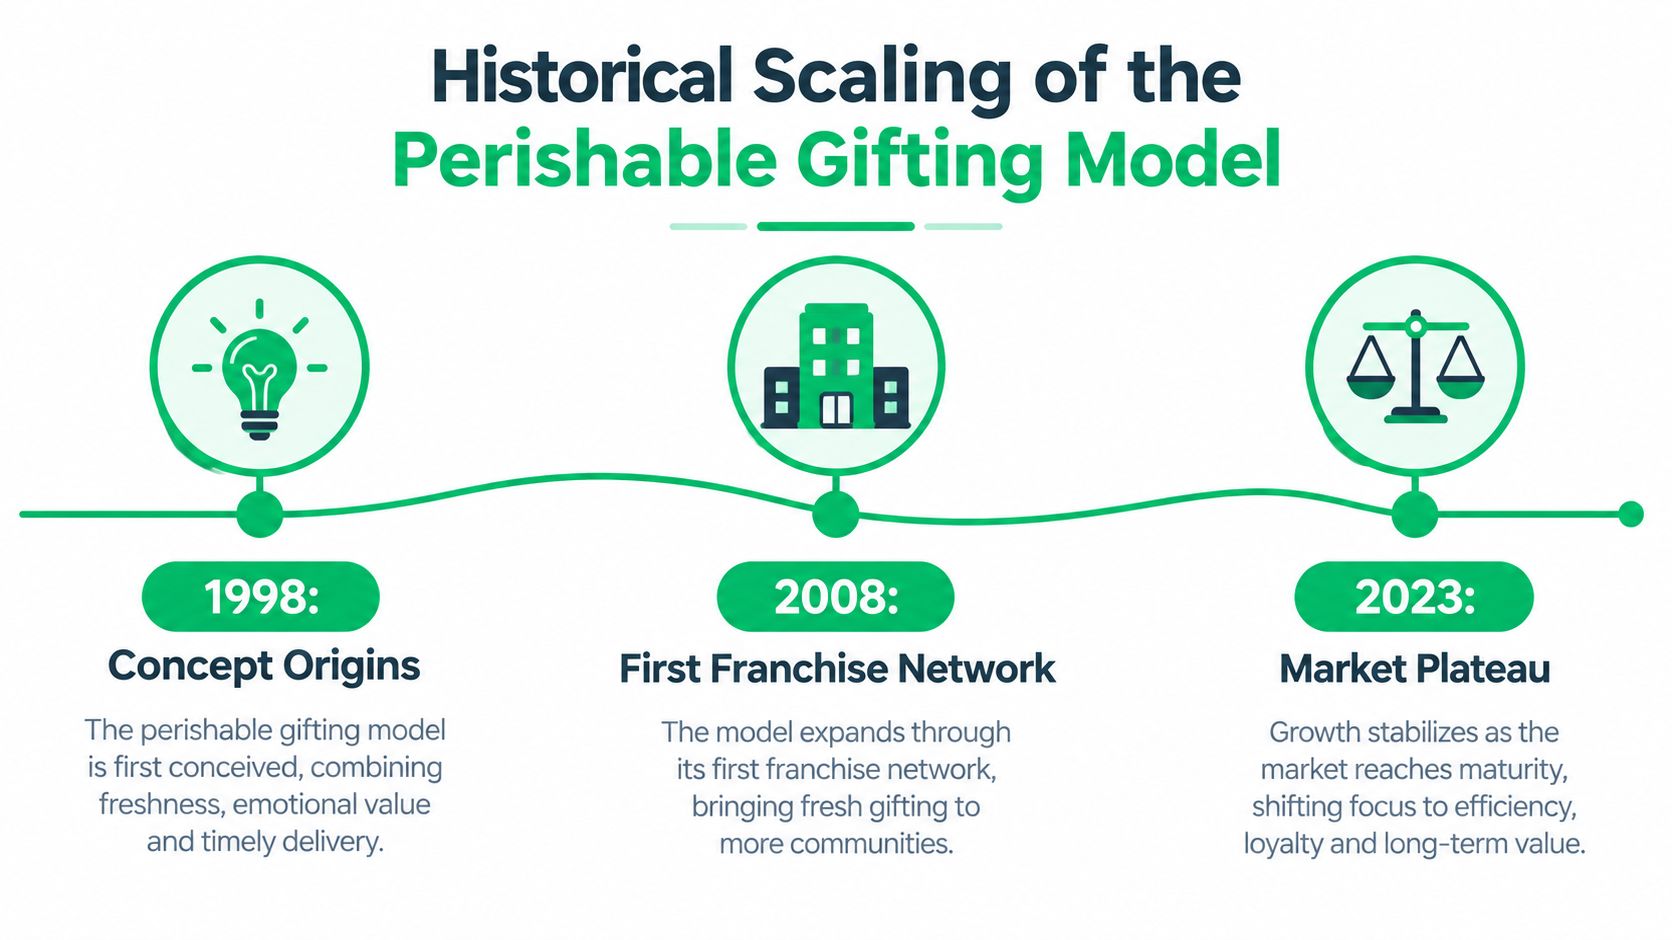
The edible-fruit-bouquet format began in the United States in 1999, when Tariq and Kamran Farid opened the first Edible Arrangements store in East Haven, Connecticut (historical company overview). The concept applied floral design techniques to fresh fruit, replacing flowers with cut and sculpted produce. Operationally, however, it remained closer to fresh-food preparation than conventional floral merchandising, creating exposure to labor, freshness, and delivery constraints.
The early timeline explains why the format attracted franchise capital. The business began franchising in 2001, with its first franchise location opening in Waltham, Massachusetts. By 2006, the company had 500 franchise locations. That expansion showed that standardized preparation and occasion-based ordering could support multi-unit replication.
Revenue multiplication required operational standardization
Annual revenue reached approximately $301 million in 2008, compared with about $1 million in 2002, a roughly 300-fold increase over six years. The result depended on more than product appeal. It required repeatable preparation methods, store procedures, delivery routines, gifting occasions, and franchise sales infrastructure.
By 2009, the company had more than 900 locations worldwide and approximately 5,500 employees. Revenue projections for that year reached $424 million, representing expected growth of about 40 percent from 2008. The company opened its 1,000th franchise in Cranston, Rhode Island, in 2012, and expanded into 15 countries.
The category scaled by converting a handcrafted-looking product into a repeatable operating system:
- Standardized production: Cut and sculpted fruit could follow repeatable designs.
- Delivery-led occasion demand: Birthdays, holidays, congratulations, sympathy, and corporate gifting created purchase occasions without requiring daily visits.
- Product extension: Chocolate-covered fruit, smoothies, salads, baked goods, gift baskets, and related gifts expanded the transaction beyond a single bouquet.
That architecture also creates saturation risk. As a system expands across markets, each additional unit must support delivery density, labor productivity, freshness, and local occasion demand. Historical scale demonstrates replication capacity. It does not establish that every remaining territory can support another franchise or that reported revenue converts into attractive unit-level economics. FDD Item 19 revenue representations therefore require separate review from Item 20 network churn before scale is treated as evidence of franchise-system health.
Analyzing FDD Item 20 Churn and Unit Turnover
Item 20 converts a headline location count into evidence about franchise-system health. FTC guidance states that it includes statistical information on franchised and company-owned outlets for the preceding three-year period. Current and former franchisee information also supports validation calls and turnover analysis (FTC Franchise Rule compliance guide).
The same 2025 profile cited above reports 91 terminations, 22 non-renewals, 37 transfers, and one projected new unit during the relevant period. These categories require separate treatment. Terminations indicate exits before renewal, non-renewals indicate contracts ending without continuation, and transfers may preserve an outlet while changing its ownership base. For an investor, each event affects development needs, support requirements, and valuation differently.
Item 20 activity requires a bridge from gross openings to net growth
| Metric category | Reported count | Strategic implication |
|---|---|---|
| Terminations | 91 | Indicates units leaving the system before or outside renewal |
| Non-renewals | 22 | Signals retention pressure at contract expiration |
| Transfers | 37 | Shows ownership movement and potential operator concentration |
| Projected new units | 1 | Provides limited offset to reported departures |
The reported terminations, non-renewals, and transfers total 150 events, but that figure is not a precise closure count. Transfers may not represent closures, and the available information does not establish whether every event falls within an identical measurement window or whether classifications overlap. The analytical conclusion is narrower and more useful: documented turnover activity substantially exceeds projected new-unit activity.
That imbalance changes how an investment committee should assess franchise development. Replacing departing operators without improving candidate fit can preserve outlet counts while weakening the ownership base. Former franchisees may identify recurring pressures involving labor, delivery radius, product waste, territory economics, or capital requirements. Current franchisees can test whether the operating model works under present conditions, rather than relying on the system's historical expansion phase.
Turnover changes the M&A question
Beyond brand recognition, the consequential diligence questions concern who owns those units, why operators exit, and whether transfers create concentration risk. Item 20 can indicate whether growth rests on durable multi-unit operators or on a rotating pool of owners who require repeated recruitment.
Perishable retail economics make operator continuity more informative than unit count alone. A transfer can avoid an immediate closure while still signaling ownership strain, succession issues, or uneven territory performance. Terminations and non-renewals provide a different warning: the system may be losing locations or operators faster than development replaces them.
Comparisons across QSR, home services, real estate brokerages, fitness and wellness, automotive services, retail, education, senior care, and health and beauty require adjustments for labor and capital intensity. The principle remains consistent. Analysts should combine Item 20 outlet histories with benchmarking franchise system growth, examining closures, transfers, renewals, and projected openings rather than relying on headline unit totals.
Navigating FTC Compliance for Perishable Retail Investments
Perishable retail concepts create a particular risk for franchise sales teams because the financial story can sound intuitive. A development executive may describe recurring occasions, delivery revenue, complementary products, and reported unit sales, but those statements can become financial performance representations if they communicate revenue, income, or profit expectations.
FTC guidance identifies Item 19 as the specific location for financial performance representations. The FTC doesn't require a franchisor to provide earnings information, but if the franchisor makes such a claim, it must have a reasonable factual basis and include the representation in Item 19 (FTC guidance on financial performance representations).
Separate investment disclosure from earnings claims
Item 7 addresses the initial investment required to establish and operate the franchise. Item 19 addresses permitted financial performance representations. Item 21 contains the franchisor's financial statements. These sections answer different questions and shouldn't be blended into a sales narrative.
| FDD section | Core use in sales diligence |
|---|---|
| Item 7 | Presents the required initial investment range and categories |
| Item 19 | Controls substantiated sales, revenue, income, or profit representations |
| Item 20 | Shows outlet activity, turnover, transfers, and franchisee contacts |
| Item 21 | Provides franchisor financial statements for corporate-level review |
A compliant sales process should map every script, email, broker presentation, executive deck, and outbound message to the appropriate FDD section. If a claim concerns unit revenue, it belongs in the Item 19 framework. If it concerns startup capital, it should align with Item 7. If it concerns system durability, Item 20 supplies the relevant outlet evidence.
The 14-day checkpoint governs execution
The FTC Franchise Rule requires franchisors to provide a disclosure document containing 23 specified categories of information, and the FDD must be delivered at least 14 days before a prospect signs a franchise agreement or pays money to the franchisor or an affiliate (FTC franchise buying guide). The rule applies across QSR, home services, fitness and wellness, automotive services, retail, education, senior care, and other franchise categories.
For a perishable retail brand, compliance should be integrated before the candidate reaches the commitment stage. Development leaders can use data-driven FDD insights to compare how Item 7, Item 19, Item 20, and Item 21 support the commercial narrative, but legal review remains responsible for final disclosure and sales-material controls.
Cold Chain Logistics and Operational Margin Pressures
The revenue benchmark for edibles fruit bouquets becomes less useful when operators model the product like shelf-stable retail. Cut fruit exposes moist interior surfaces and creates conditions more favorable to microbial growth than intact produce. Food-safety guidance generally recommends keeping cut fruit at or below 4 to 5 degrees Celsius, using refrigerated or insulated transport, and discarding cut fruit left at room temperature for more than two hours (fresh-cut produce safety guidance).
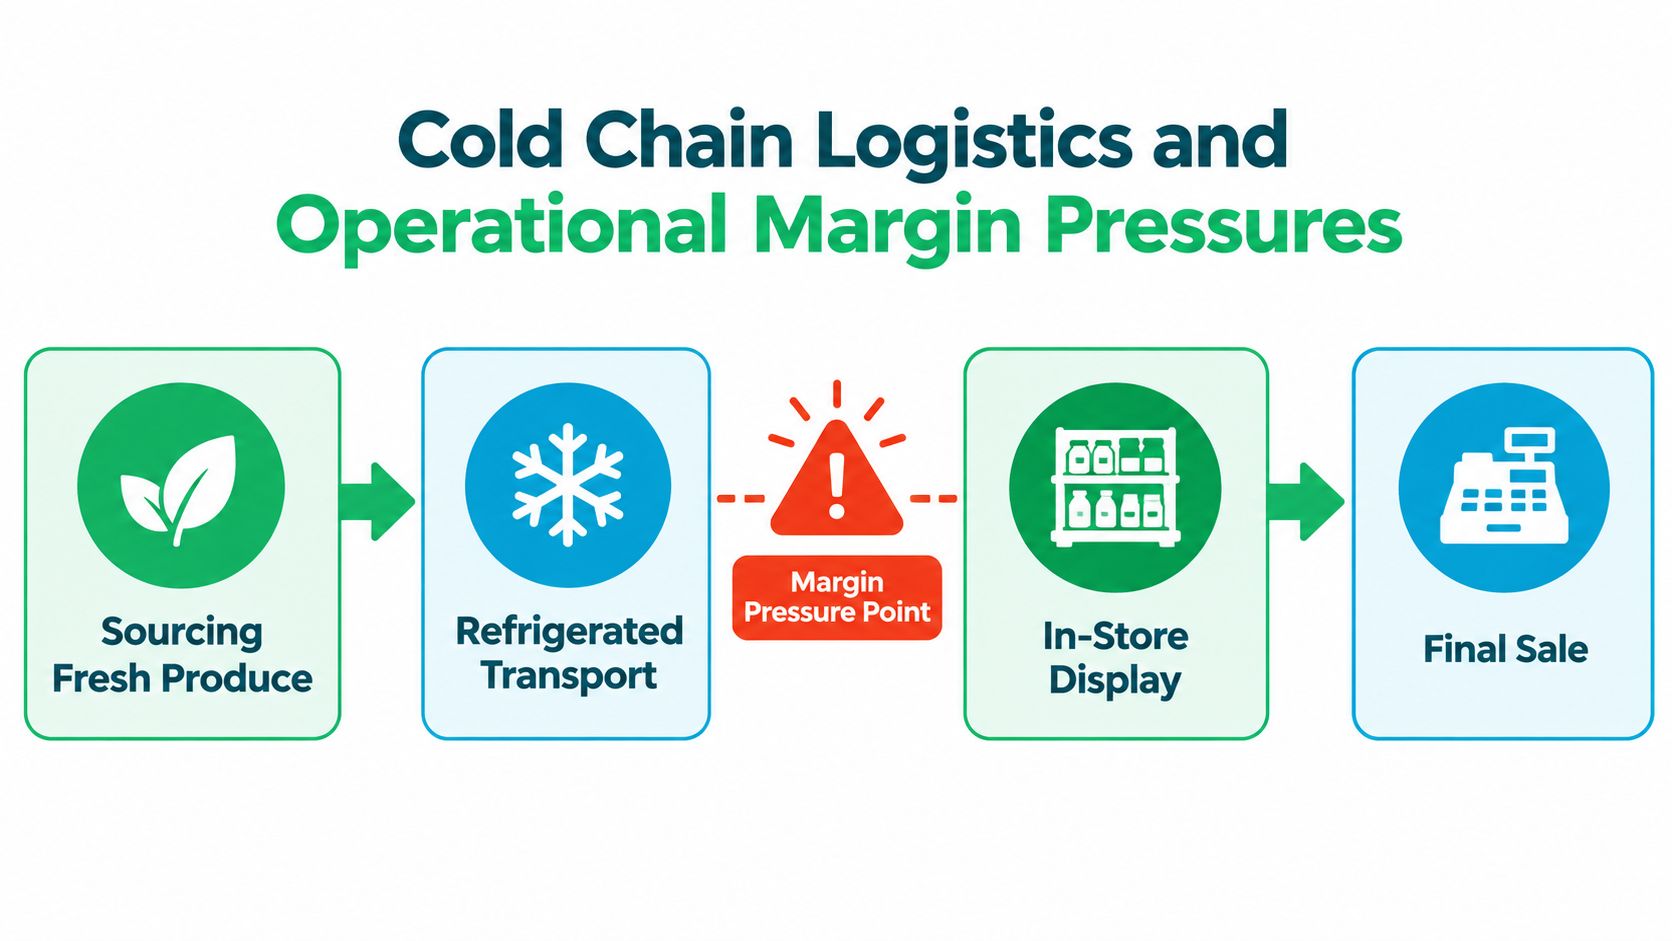
Those requirements affect margin before a customer receives the order. Refrigeration influences staging space, delivery timing, packaging design, route density, labor scheduling, and waste decisions. A bouquet assembled locally may reduce transit distance, but poor temperature control can create more spoilage. Heavy insulation and cold packs can protect quality while increasing packaging consumption and handling complexity.
Delivery promises don't measure temperature integrity
“Same-day delivery” describes timing, not food safety. A system can complete an order on the promised day while losing temperature control during preparation, staging, transit, porch delivery, or handoff. For unit-level modeling, the relevant operating question is whether the cold chain remains intact across every stage.
A practical protocol should include:
- Preparation control: Keep cut fruit refrigerated during assembly and staging.
- Transport control: Use refrigerated or insulated transport with suitable cold packs.
- Handoff control: Confirm delivery timing and limit unattended exposure.
- Receipt inspection: Check for warmth, bruising, leakage, or compromised packaging.
- Escalation control: Give recipients a clear process for contacting the seller when an order arrives warm.
Temperature also affects product selection. Melons, berries, grapes, and pineapple differ in texture, browning, water activity, and sensitivity to transit conditions. Substituting fragile berries or bananas may improve delivery performance, but customization can alter both the visual result and the underlying food cost.
Margin pressure point: Every minute outside controlled refrigeration can become a quality problem, a replacement order, a refund, or avoidable food waste.
Storage design belongs in the unit model
Cold-chain execution also depends on how a unit uses vertical space. Retail operators evaluating storage layouts can review Material Handling USA vertical storage solutions for context on grocery and refrigerated inventory handling. The relevant diligence question isn't whether a storage system looks efficient. It's whether the layout reduces unnecessary movement, protects product integrity, and gives staff enough capacity to manage peak occasion demand without creating staging bottlenecks.
The accounting model should distinguish edible yield from visual volume. Chocolate, dips, non-fruit decorations, and gift packaging can increase perceived value, but they also introduce storage, allergen, handling, and disposal considerations. A unit-level forecast should therefore connect product mix to waste, labor, delivery reliability, and replacement exposure. Operators can use Franchise Fast Track's accounting resource as a reference point when organizing those cost categories.
Data-Driven Outbound Development for Retail Concepts
A category with material Item 20 turnover shouldn't rely on undifferentiated lead volume. Franchise development teams need operators who can evaluate delivery density, perishability, labor scheduling, local gifting demand, and the capital requirements disclosed in Item 7. Generic portal leads and broad paid campaigns rarely provide that qualification before the first sales conversation.
The stronger approach is to define the operator profile before launching outreach. For an edibles fruit bouquets concept, that profile may prioritize multi-unit experience in retail, QSR, foodservice, delivery, or adjacent occasion-based businesses. It should also screen for the operational discipline required to manage refrigerated inventory and the financial capacity required by the formal disclosure documents.
Candidate quality matters more than inquiry volume
Broker referrals can produce useful introductions, but the franchisor often receives limited control over timing, qualification standards, and category conflicts. Franchise portals and paid advertising through Meta or Google can generate awareness, yet they frequently place the burden of determining capital readiness, executive seniority, and multi-unit suitability on the internal development team.
A structured outbound program reverses that sequence. It starts with a defined territory and operator thesis, identifies verified contacts, screens for fit, and routes qualified conversations directly to the sales calendar. That process is especially relevant for brands with 50 or more existing locations, where development leaders must protect executive time while balancing new-unit growth against existing franchisee retention.
The underlying data infrastructure can include a registry of 7,000+ franchise brands, a database of 68,000+ FDDs, a directory of 31,000+ multi-unit franchisees, and 3.5 million classified franchise industry contacts (Franchise Fast Track). Those figures describe the available research architecture, not a guaranteed outcome for any individual campaign. The strategic value lies in connecting franchisee identity, brand category, FDD history, and executive role before outreach begins.
Outbound should reinforce Item 19 and Item 20 discipline
Outbound messaging for perishable retail concepts shouldn't promise income or imply that historical system revenue automatically transfers to a new unit. It should position the opportunity around the operating model, required diligence, territory evaluation, and the evidence available through Items 7, 19, 20, and 21.
The same discipline improves candidate quality. An executive who responds to a transparent explanation of cold-chain requirements and network turnover is more likely to understand the operating challenge than a lead attracted only by product aesthetics. Development teams can then use discovery calls to test labor strategy, delivery execution, local marketing capability, and plans for multi-unit replication.
Teams evaluating this channel can review franchise development marketing for a model centered on targeted franchisee recruitment rather than unqualified inquiry volume. For edibles fruit bouquets, that shift is more than a marketing preference. It aligns candidate acquisition with the category's actual investment case: top-line potential exists, but durable value depends on operator quality, cold-chain execution, and the ability to reverse network churn.
Franchise Fast Track combines franchise development support with structured intelligence across brands, FDDs, multi-unit franchisees, and industry contacts. For an edibles fruit bouquets platform, that infrastructure can support category benchmarking and targeted outreach to operators who fit the concept's operational and capital profile. Visit Franchise Fast Track to evaluate the available development and franchise intelligence resources.
Ready to see results like these for your franchise?
Stop wasting money on leads that never close. Start getting hundreds of replies from high-net-worth professionals daily.